The New Stimulus Bill President Biden just signed another stimulus bill, aimed to help those affected by the virus (and to deal with a few other matters found in...
Don’t Be Deceived By Mutual Funds
Best Mutual Funds?
Since the bull market run started 10 years ago, how many mutual funds would you guess outperformed the stock market?
If you are thinking 500, 200 or even 20, you are very wrong. In fact, not one single mutual fund has beaten the market since 2009. After pondering that fact, does that make you want to change what you invest in? Remember all those expensive, slickly produced TV and magazine ads boasting market beating ratings and top quartiles? You know, the ones that show an incredibly good looking, but aging couple walking hand in hand into the sunset on a deserted beach? They all are just so much bunk. The funds mentioned rarely quote performance beyond one or two short years.
Not too long ago, the New York Times studied the performance of 2,862 actively managed domestic stock mutual funds since 2009. It carried out a simple quantitative analysis, looking at how many managers stayed in the top performance quartile every year.
ZERO was their final conclusion. It gets worse…. It is very rare for a mutual fund manager to stay in the top quartile for more than one year. All too often, last year’s hero is this year’s goat, usually because they made some extreme one-sided bet that turned out to be a flash in the pan. The harsh lesson here is that investing with your foot on the gas pedal going 100 miles per hour and your eyes on the rearview mirror is certain to get you into a fatal crash.
“It is possible that any one of these mutual funds will beat the market over the long term,” … “Some of them will do that. But the problem is that we don’t know which of them will do that in advance.” And that, in a nutshell, is the kernel of the argument for buying index funds.
-New York Times
In their investigation, The NY Times did come across two mutual funds which did beat the S&P500 for five years. These small cap energy funds more than average amounts of risk to achieve these numbers and have since lost most of their money.
The underlying causes for the pitiful underperformance are many and they highlight the reasons ETFs are coming on strong. Mutual fund management fees are high and more buried costs are hidden in the fine print of the prospectus. The managemnt fees that are quoted are just the tip of the iceberg.
Any proven, real talent soon flees the mutual fund industry, with all the real brains leaving to start their own hedge funds and investment advisory services. The inside joke among hedge fund managers is that employment at a mutual fund is proof positive that you are a lousy manager.
Let’s revisit those high dollar mutual fund TV ads. They cost tons of money to make. All the production costs of the commercials are rolled up into those 12B-1 hidden fees you never really see unless you hunt through the prospectus. These commercials and print ads are made at the expense of the fund investors thus yielding you a lower return on investment on your money. And those sexy performance numbers? They benefit from a huge survivor bias. If a mutual funds performance is substandard, it is at risk of being closed. As there is a impending desire to protect the other funds in the family. Trying to find mutual funds with standout records spanning 2 decades is near impossible. Like finding the proverbial needle in a haystack.
But since we are on a roll, its hard to imagine that the mutual fund industry as a a whole woefully underperforms the basic S&P500 averages. How could this be? Random picks from the stock pages of your local paper would probably create a better investment return than the majority of the mutual fund industry.
Two years ago, when he signed the Dodd-Frank Wall Street Reform and Consumer Protection Act, President Barack Obama bragged that he’d dealt a crushing blow to the extravagant financial corruption that had caused the global economic crash in 2008. “These reforms represent the strongest consumer financial protections in history,” the president told an adoring crowd in downtown D.C. on July 21st, 2010. “In history.”

This was supposed to be the big one. At 2,300 pages, the new law ostensibly rewrote the rules for Wall Street. It was going to put an end to predatory lending in the mortgage markets, crack down on hidden fees and penalties in credit contracts, and create a powerful new Consumer Financial Protection Bureau to safeguard ordinary consumers. Big banks would be banned from gambling with taxpayer money, and a new set of rules would limit speculators from making the kind of crazy-ass bets that cause wild spikes in the price of food and energy. There would be no more AIGs, and the world would never again face a financial apocalypse when a bank like Lehman Brothers went bankrupt.
Two years later, Dodd-Frank is groaning on its deathbed. From the moment it was signed into law, lobbyists and lawyers have fought regulators over every line in the rulemaking process. Congressmen and presidents may be able to get a law passed once in a while – but they can no longer make sure it stays passed.
With millions of dollars being spent on high paid Washington lobbyists, the mutual fund industry continues to complain about overregulation. Plus, don’t forget, that the costs of the lobbyists also come out of your fund performance as well.
This is why the overwhelming bulk of investors are better off investing in the lower cost ETFs that have become so popular with investors, diversifying holdings among a small number of major asset classes, and then rebalancing as needed to keep the winners in play.
Research Financial Strategies does not charge you with any of our overhead. I am not jacking up what you pay me based on what I spend. I don’t even sell your email address to another online marketer. Being an independent operation of a dozen or so people, I’ll tell you what I don’t have. I lack an investment banking department telling me I have to recommend a stock so we can get the management of their next stock and we don’t have any in-house mutual funds from which we profit more and are required to push.
You just need to pay me a low, flat fee. I don’t need any more.
For over 25 years, Research Financial Strategies has been serving families and businesses as their investment advisor. Let us put our money management expertise to work for you. Set up a consultation by either filing out our contact form or by calling us at 301-294-7500. We are here for you!
Source: NYTimes.com
Most Popular Financial Stories
Stimulus Bill Analysis
read more
Trending Now-2021-S&P Hits 4000
milestone (noun)1 a stone functioning as a milepost 2. a significant event or stage in the life, progress, development, or the like of a person, nation, etc. The...
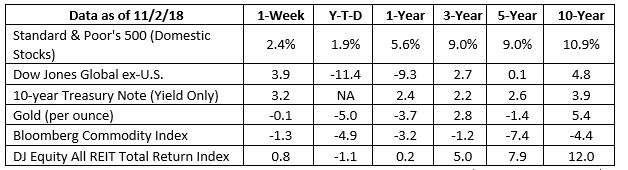
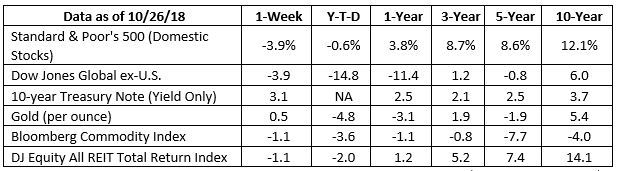
End Of Week Market Update
End Of Week Market Update One year. It seems incredible, but it’s been one year since COVID-19 struck our shores. One year since the World Health Organization...
Don’t forget about your 2020 IRA contributions!
There’s still time to contribute to your IRA!If you haven’t already contributed to an IRA (Individual Retirement Account), there’s still time to do so. Many...

Special Edition from Jack – the 45 DAY REPORT!
Special Edition from Jack – the 45 DAY REPORT! Friends and Clients, Hard to believe, isn’t it? The first quarter is half over. The year is 45 days old. It’s 1/8th over...

Valentine’s Day Message
How Are Your Investments Doing Lately? Receive A Free, No-Obligation 2nd Opinion On Your Investment Portfolio > December 9, 2020 Our Mission Is To Create And Preserve...