Hot Dog Inflation at the Ballpark

When you hear “hot dog” and “inflation” in the same sentence, you might think of those supermarket franks that plump up when cooked. In this case, we’re talking about the original dogs of the ballpark, a cultural touchstone of America’s pastime.

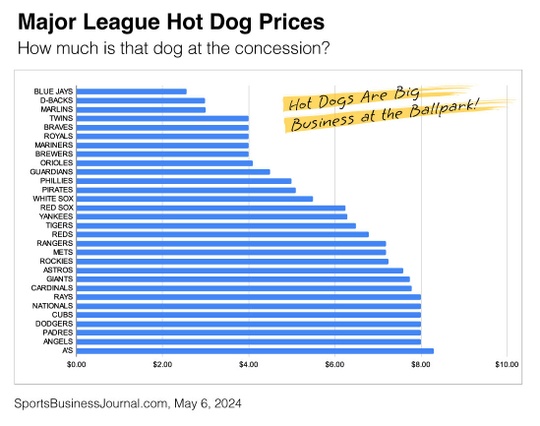
The average price of a Major League Baseball (MLB) hot dog across the 30 North American ballparks is $5.99, and that’s for the lowest-priced hot dog offered at the parks. That average covers a wide range, including the $8.39 “Colossal Dog” offered at Oakland Coliseum, home of the Athletics, and a $2.99 option at Chase Field, where the Arizona Diamondbacks play.1

You’ll need to grab your passport if you’re looking for the cheapest dog in the MLB. When you take in a Toronto Blue Jays home game, you can find a $2.55 hot dog at Roger Centre.1

From the chart, you can see that seven of the top ten highest-priced dogs are for teams that may not make the playoffs. On the other hand, eight of the ten least expensive dogs are at stadiums where teams are fighting for a playoff spot.

While consumers are used to seeing a mark-up on concessions at movie theaters, concerts, and sporting events, MLB offers a relatively inexpensive option compared to the National Football League (NFL).

The average cost for a family of four is $180.54, which figures tickets, parking, beverages, and (of course) hot dogs. That range is higher in some cities, over $320 in Los Angeles (the Dodgers) or Boston (the Red Sox), and lower in others. A family can see a game for under $140 in a handful of lower-end markets: the Cincinnati Reds, Colorado Rockies, Cleveland Guardians, Kansas City Royals, and Chicago White Sox.2

The reason for the boosted prices? Concessions play a big part in maintaining the grounds and paying for the teams. Dodgers pitcher Shohei Ohtani inked a $700 million, 10-year contract with the team. That means the Dodgers hope you show up to the game hungry!2

As the season winds down, I hope you have enjoyed a few games, whether at the ballpark or at home. At my house, the dogs always come dressed the way I like them and are considerably less expensive!

1. Sports Business Journal, May 6, 2024
2. The Street, April 12, 2024

Special content from Jack, very short read!

Uh oh! Signs of a potential financial market correction may be on the horizon:

  • The S&P 500 is down 4% from its all-time high.
  • Investors are showing increased interest in gold, silver, copper, and other commodities, which are often seen as safe havens during economic downturns.
  • Geopolitical tensions remain high in the Middle East and Ukraine which definitely creates nervousness in the financial markets.
  • There are weaknesses in some areas of the US stock market, including major companies like Apple and Tesla, as well as retail stores, commercial real estate, and an increased consumer debt load.

But: The good news is we anticipated probable market weakness and took action last week. The RFS growth model is 70% short, and LONG gold, silver, copper, and commodities. So we are in great shape for a major market pullback.

Don’t forget we are always here for you and your family.

Jack


S&P500  -1.2%
RFS Aggressive Growth Model (AG)  +.26%
RFS Aggressive Growth + Model (AG+)  +.26%

* End-of-day market returns as of 4/15/2024 

Special Edition from Research Financial Strategies

Dear Friends and Clients,

This week, a good friend and client brought something significant to my attention. Despite our initial struggles to uncover the full story, my resourceful son-in-law managed to locate it. It comprises three parts and runs approximately 45 minutes in length. I urge you to take the time to watch it.

Why? Firstly, it offers riveting entertainment as Jon Stewart effectively dismantles Jim Cramer’s narrative regarding the events spanning from October 2007 to March 2009. Secondly, it stands as a testament to its accuracy—Jim Cramer’s defense boiled down to mere claims of being misled by acquaintances. And thirdly, it resonates with a message I’ve been advocating since 1991: the narrative of bear markets. Over the past 99 years, there have been a total of 20 such markets. Do you believe there won’t be a 21st? As a reminder, during the 2007-2009 bear market, when the SP-500 was -57%, the RFS growth model was -4%.

Allow me to share something I am deeply passionate about—the untold side of the story. Yes, a market decline of 57% is staggering. But what many fail to grasp, unless they delve into the statistics or engage with mental health professionals, is the collateral damage. As the bear market persisted, reaching into the summer of 2009, we witnessed alarming spikes in suicides, depression, domestic abuse, violence, substance abuse, foreclosures, evictions, and repossessions. These are the grim realities obscured by the buy-and-hold rhetoric espoused by firms like Vanguard and Fidelity.

As a wise general once remarked, “Those who don’t learn from history are doomed to repeat it.” I implore you to watch the videos, encourage your adult children to do the same, and share them with anyone in your circle who could benefit from the unvarnished truth. For, alas, such truths are seldom found on the polished surfaces of Fidelity or Vanguard websites.

 Very seriously,

 Jack


Part 1: 
https://www.cc.com/video/fttmoj/the-daily-show-with-jon-stewart-exclusive-jim-cramer-extended-interview-pt-1

Part 2:
https://www.cc.com/video/iinzrx/the-daily-show-with-jon-stewart-jim-cramer-pt-2

Part 3: 
https://www.cc.com/video/gliow5/the-daily-show-with-jon-stewart-jim-cramer-pt-3

The Fed’s Drive To 2% Inflation

February isn’t over yet, but the Cleveland Fed has released its projections for a few key economic markers. Why are these markers important? The Fed likes to look at the Consumer Personal Expenditures (CPE) to gauge whether or not their plan to curb inflation is working. The projected CPE for February is 2.27, trending towards the 2% the Fed is looking for before announcing that inflation has been under control. Given the Fed’s caution about reducing interest rates until the CPE is holding steady at 2% or lower, the Fed will likely only reduce interest rates once these markers are met. In the meantime, stay focused on your financial goals, and if you have any questions/concerns, please don’t hesitate to reach out.

Social post attachment 1

Consumers Expect Better Days Ahead

Many consider the University of Michigan the gold standard for reporting on consumer sentiment and trends. Among its 50 monthly reports, the most well-known is the “UMich Consumer Sentiment” survey, which measures consumer confidence.

I also follow the University of Michigan’s “Expected Change in Financial Situation in a Year” report. As we see below, the index has been trending higher for over a year as inflation has moved lower and financial markets gained.

Investors believe their financial situation will improve due to a wide range of factors, including interest rates and home prices, to name a few. When investors are positive about the future, they tend to be more comfortable making longer-term commitments.

So when you see negative updates on credit card debt, the jobs market, or other reports, remember what this chart tells us: Despite all the concerns, people believe their financial situation will improve.

6Lc_psgUAAAAAA9c7MediJBuq3wAxIyxDSt73c9j