Election Day and your Portfolio

Two-hundred and seventy.  That’s how many electoral votes it takes to win.  As of this writing, on the afternoon of Wednesday, November 4, 2020, neither candidate has reached that magical number yet – and it may be some time before we know who will.

As you’ve probably heard us say before, uncertainty is the thing investors fear most, and as of right now, there’s still a lot of uncertainty regarding this election.  It’s no surprise, then, that many of our clients have asked us about the election lately and how it may affect their portfolio.  We’ll get to that in a second, but the first thing we want to say is: If you’re nervous, you can relax.  And if you’re relaxed, you can stay that way!  In this case, all this uncertainty was expected, and it’s no surprise the election is still up in the air.  

In a normal year, most Americans are accustomed to either watching the TV on election night, waiting for the media to call the various states in favor of one candidate or another.  Or maybe you’re the type who prefers to just go to bed early and see who won in the morning, (which is probably the healthier option).  But this is not a normal year…and it’s certainly not a normal election.

Here’s the situation.  Due to the COVID-19 pandemic, more Americans are voting by mail or ballot box than ever before.  That means election officials have to do things a little differently.  Some states have laws preventing mail ballots from being counted until after a certain point.  Take Pennsylvania, for example.  In 2019, the state approved “no-excuse” absentee ballots, where any voter can request a mail ballot without needing to cite a reason.1  At the same time, however, Pennsylvania law requires officials to wait until after the polls closed on election night before they could begin counting those mail ballots.  And many counties in the state waited until Wednesday morning to start processing those ballots.  Since mail-in ballots often take longer to verify than in-person ballots, the result is a delayed timeline.  In fact, it may be several days before all the votes are counted there.  

Another variable at play here is that some states – Nevada and North Carolina, for example – will count mail ballots that arrive after the election but were postmarked before.2  So, some states may not officially declare a winner until next week, although the media may call those races earlier if they feel there’s enough data on who will win.  

As luck would have it, nearly all the states we’re still waiting on are key “battleground” states that both candidates are desperately trying to win.  Many of these so-called swing states, each coming with a hefty number of electoral votes, are still processing their ballots.  That’s why many states remain “too close to call” by the media, although some will finish counting sooner than others.   

As of this writing, the following states are still up in the air: Alaska, Arizona, Georgia, Maine, Michigan, Nevada, North Carolina, Pennsylvania, and Wisconsin (Fox News did call Wisconsin for Biden at 3:20 this afternoon).  Some will almost certainly finish counting today.  Others, like Pennsylvania, may take several more days or even weeks.  So, while we may have a strong idea of who the winner is by the end of the day, it also may take much longer.  

The important thing to remember here is that the media does not decide the winner of each of these states.  Nor, frankly, do the candidates.  It’s true that the media will “call” each race as soon as they feel certain of the outcome, and they’re usually – but not always – right.  But these calls are technically meaningless.  Every county in this nation conducts their own election overseen by a county clerk.  Those votes are then tabulated – and the results certified – by each state’s Secretary of State.  Sometimes this process takes longer than others, and it’s been expected for months that the process would take particularly long in 2020.  So, my advice is to relax and focus on other things.  Most importantly, try to ignore all the gossip being thrown around on social media.  Much of it is fearmongering, and both sides of the aisle are guilty of it.  (That said, let’s all spare a thought for the thousands of people across this country who have volunteered their time to man polling locations and count ballots.  Many stayed up all night; many more will continue working for days.  It’s a hard, thankless job – but there is no more important responsibility in our nation right now.  If you know one of these people, please thank them for me!)

Before we put the final period on this message, I wanted to leave you with a quick thought about your portfolio.  We mentioned before that uncertainty is what investors hate most, but as of this writing, the markets are handling this uncertainty rather well.  We also know that politics and emotion go hand-in-hand.   It’s easy to react emotionally and fear what the election will mean for your hard-earned money.  That’s why I want to reassure you of three things:

1.   Historically speaking, the outcome of a presidential election has a relatively small impact on the markets.   Historically, the S&P 500 has gone up 10.8% under Democratic presidents and 5.6% under Republicans.3 Either way, the markets have risen over time.  Of course, we must always remember that past performance is no guarantee of future results.  But the point is, making investment decisions based solely on who sits in the White House is not a good idea.  

2.   From a policy standpoint, both Trump and Biden could bring positives and negatives when it comes to the markets.  I’ll send more info about this when we know who the winner is.  In the meantime, remember: our investment strategy is designed to get you through more than one election cycle, and its success does not depend on politics.  While political developments may prompt us to make tweaks here and there, our strategy is based on far more important factors.  

3.   Regardless of who wins, our team will be constantly studying the markets and keeping an eye on your portfolio.  If we ever feel changes need to be made, we’ll contact you immediately.  

In the meantime, let us know if you have any questions or concerns.  We’d be happy to chat.  Have a great day!          

Special Message

Pandemics – Protests – Wildfires – Market Crashes – Recession

If someone ever tries to tell the story of 2020 on film, it will take more movies than Star Wars. At one point, we even had to worry about murder hornets. Murder hornets! There’s no question this year has been a crazy one. But it’s about to get even crazier. After all, a new presidential election is only a week away.

Over the last few weeks, several clients have asked me what the election could mean for the markets. At a time when there is so much uncertainty to deal with, the thought of adding an election to the mix can seem overwhelming. So, I thought I’d write about how we should prepare for both the run-up and aftermath of the election.

What exactly does the upcoming election mean for the markets?

Short-Term View: Prepare for Volatility

Uncertainty: That’s the key word. Investors hate it, the year has been full of it, and the lead-up to a presidential election just brings more of it. As a result, the markets often see increased turbulence just before an election. For example, in October of the last four presidential election years, the markets fell.1 I don’t ever try to predict the future, but we should be especially prepared for volatility this year. That’s because there are still so many question marks surrounding our economy and the pandemic.

Pandemic. It is showing no signs of stopping, and indeed cases may climb again as winter sets in. The economy has improved, but is still on thin ice, with unemployment rates still stubbornly high. Investors are watching Congress with bated breath, waiting to see whether they’ll enact a new stimulus package. If not, that could spell trouble, as many economists believe more stimulus is needed for the economy to recover.

Election Turmoil. There’s another reason why we should prepare for volatility: The possibility of delayed—or worse, disputed—election results. Thanks to the pandemic, more people are likely to vote by mail than ever before. Mail-in ballots take longer to count than traditional ones, and some states “will count ballots that are delivered after the election if they are postmarked by a deadline.”2 Because election officials are more concerned with counting votes correctly than quickly, we may not have a winner declared for several days or even weeks. In fact, earlier this year, during primary season, several states needed more than a week before they could declare a winner.

Remember 2000? If the losing candidate feels there are grounds to contest the results, that could delay the process even further, leading to—you guessed it—more uncertainty and thus more volatility. We don’t have to look far back in history to see what the markets did the last time results were delayed. Remember the drama surrounding the 2000 election? On election night, Florida’s results were considered too close to call. Over the next month, Americans learned more than they ever wanted about things like dimpled chads and butterfly ballots. The S&P 500, meanwhile, dropped over 8% between election day and December 15 when the result was finally decided.3

Now, none of this is to say that pre- and post-election volatility is guaranteed. It’s not. We should, however, prepare ourselves for it. Because the more mentally prepared we are to weather short-term uncertainty, the better equipped we are to remember…

The Long-Term View: Follow the Indicators of the Market

Every four years, I hear people say, “If the Democrats/Republicans win, I’m going to sell (or buy) because that means the markets will fall (or rise).” It’s understandable why people think this way. After all, politics play an increasingly large role in our daily lives. Why wouldn’t they impact our portfolio, too? But the truth is, presidential elections are relatively unimportant when it comes to the markets, at least in the long-term.

A quick look at history bears this out. Historically, the S&P 500 has gone up 10.8% under Democratic presidents and 5.6% under Republican presidents.4  That’s not a large difference and can be attributed to a whole range of factors besides politics.

Either way, the markets tend to go up over time. One thing I’ve noted in recent years is that as elections get more partisan, so too does the rhetoric about how the candidates will impact the markets. For example, here’s the opening sentence from a CNBC article published on November 3, 2016, shortly before the election:

Wall Street’s long-running view that Hillary Clinton would easily become the next president has been replaced by a new fear that Donald Trump could win, and it probably won’t be a pretty picture for stocks if he does.5

Here’s a snippet from an article in the New York Post written a few months before Barack Obama was first elected:

…it’s hard to see how a President Obama would be good for Wall Street. He wants to raise the capital-gains tax…[which] would be great for the tax-shelter business, but stocks would tank…in other words, the markets could fall further from their already-beaten down levels once the street begins to focus on an Obama presidency.6

Both these predictions ended up being wide of the mark. In the first year of President Obama’s presidency, the markets rose 23.45%.7 In President Trump’s first year, the markets gained 19.42%.8

Doom and gloom is predicted more and more with each election. Yet the markets keep going up over time. This is exactly why, overall, we are long-term investors.

But we will not sit by and watch your assets deteriorate. As usual, we’ll be watching our indicators like a hawk, and when we see trouble brewing, we will act. On the 22nd, for example, a signal alerted us to weakness developing in our TQQQ position (an ETF, based on the Nasdaq’s top 100 companies, we hold in our growth-oriented portfolios). ​​  We sold that position and now wait for further evidence of weakness, at which time we’ll take on defensive positions and lighten up on long positions.

As a rule, we like to keep politics out of your portfolio and instead focus on our technical indicators. It’s true that Trump and Biden have different economic policies, and some of their policies will affect the markets to a degree. But the markets reflect millions of investment decisions by millions of investors. The president is just one ingredient. Far more important are supply and demand, innovation and invention, mergers and acquisitions, the ebb and tide of trade, and a host of other economic developments both large and small.

Making major investment decisions based on politics alone makes little sense. Instead, we’ll make our decisions based on what the market has to say. 

So, what does the election mean for the markets? In the short-term, potentially a lot. In the long term, probably not much.

After Trump and Biden Are Gone

2020 has been a long, crazy year. It’s possible the next few months could be even crazier. But in the grand scheme of things, they are still just a few months, and this is still just one year. We’ll be investing long after Trump and Biden are both names in the history books.

In the meantime, always remember that my team and I are here for you. We’re happy to review your portfolio, answer your questions, and address your concerns.

Thank you for the trust you’ve placed in us, and please let us know if we can ever be of service. Be well, stay safe, and enjoy the rest of your year!

Most Popular Financial Stories

Memorial Day Thoughts

Memorial Day Thoughts

Memorial Day Thoughts When I was young, I remember asking my parents why we observe Memorial Day. While some people use it mainly as a chance to throw a backyard...

read more
Stimulus Bill Analysis

Stimulus Bill Analysis

The New Stimulus Bill President Biden just signed another stimulus bill, aimed to help those affected by the virus (and to deal with a few other matters found in...

read more
Trending Now-2021-S&P Hits 4000

Trending Now-2021-S&P Hits 4000

milestone (noun)1 a stone functioning as a milepost 2. a significant event or stage in the life, progress, development, or the like of a person, nation, etc. The...

read more
End Of Week Market Update

End Of Week Market Update

End Of Week Market Update One year.  It seems incredible, but it’s been one year since COVID-19 struck our shores.  One year since the World Health Organization...

read more


Sources
1 “S&P 500 Historical Prices,” The Wall Street Journal, https://www.wsj.com/market-data/quotes/index/SPX/historical-prices
2 “When Will We Know the 2020 Presidential Election Results? A Guide to Possible Delays,” The Wall Street Journal, https://www.wsj.com/articles/will-we-know-who-is-elected-president-on-election-night-a-guide-to-possible-delays-11596629410
3 “Why stock market investors are starting to freak out about the 2020 election,” MarketWatch. https://www.marketwatch.com/story/why-stock-market-investors-are-starting-to-freak-out-about-the-2020-election-11600964863
4 “Democratic presidents are better for the stock market and economy than Republicans, one study shows,” Business Insider. https://markets.businessinsider.com/news/stocks/stock-market-election-democratic-republican-presidents-better-performanceeconomy-gdp-2020-8-1029528932#
5 “This is what could happen not the stock market if Donald Trump wins,” CNBC. https://www.cnbc.com/2016/11/02/this-is-whatcould-happen-to-the-stock-market-if-donald-trump-wins.html
6 “Wall St. Death Wish,” The New York Post. https://nypost.com/2008/08/04/wall-st-death-wish/\
7 https://tickertape.tdameritrade.com/investing/can-election-predict-market-performance-15555
8 “S&P 500 Historical Annual Returns,” Macrotrends, https://www.macrotrends.net/2526/sp-500-historical-annual-returns

​ 


How Are Your Investments Doing Lately?  Receive A Free, No-Obligation 2nd Opinion On Your Investment Portfolio >

Weekly Financial Market Commentary

December 9, 2020

Our Mission Is To Create And Preserve Client Wealth

Most Popular Financial Stories

Memorial Day Thoughts

Memorial Day Thoughts

Memorial Day Thoughts When I was young, I remember asking my parents why we observe Memorial Day. While some people use it mainly as a chance to throw a backyard...

read more
Stimulus Bill Analysis

Stimulus Bill Analysis

The New Stimulus Bill President Biden just signed another stimulus bill, aimed to help those affected by the virus (and to deal with a few other matters found in...

read more
Trending Now-2021-S&P Hits 4000

Trending Now-2021-S&P Hits 4000

milestone (noun)1 a stone functioning as a milepost 2. a significant event or stage in the life, progress, development, or the like of a person, nation, etc. The...

read more
End Of Week Market Update

End Of Week Market Update

End Of Week Market Update One year.  It seems incredible, but it’s been one year since COVID-19 struck our shores.  One year since the World Health Organization...

read more


Investment advice offered through Research Financial Strategies, a registered investment advisor.
* This newsletter and commentary expressed should not be construed as investment advice.
* Government bonds and Treasury Bills are guaranteed by the U.S. government as to the timely payment of principal and interest and, if held to maturity, offer a fixed rate of return and fixed principal value.  However, the value of fund shares is not guaranteed and will fluctuate.
* Corporate bonds are considered higher risk than government bonds but normally offer a higher yield and are subject to market, interest rate and credit risk as well as additional risks based on the quality of issuer coupon rate, price, yield, maturity, and redemption features.
* The Standard & Poor’s 500 (S&P 500) is an unmanaged group of securities considered to be representative of the stock market in general. You cannot invest directly in this index.
* All indexes referenced are unmanaged. The volatility of indexes could be materially different from that of a client’s portfolio. Unmanaged index returns do not reflect fees, expenses, or sales charges. Index performance is not indicative of the performance of any investment. You cannot invest directly in an index.
* The Dow Jones Global ex-U.S. Index covers approximately 95% of the market capitalization of the 45 developed and emerging countries included in the Index.
* The 10-year Treasury Note represents debt owed by the United States Treasury to the public. Since the U.S. Government is seen as a risk-free borrower, investors use the 10-year Treasury Note as a benchmark for the long-term bond market.
* Gold represents the afternoon gold price as reported by the London Bullion Market Association. The gold price is set twice daily by the London Gold Fixing Company at 10:30 and 15:00 and is expressed in U.S. dollars per fine troy ounce.
* The Bloomberg Commodity Index is designed to be a highly liquid and diversified benchmark for the commodity futures market. The Index is composed of futures contracts on 19 physical commodities and was launched on July 14, 1998.
* The DJ Equity All REIT Total Return Index measures the total return performance of the equity subcategory of the Real Estate Investment Trust (REIT) industry as calculated by Dow Jones.
* The Dow Jones Industrial Average (DJIA), commonly known as “The Dow,” is an index representing 30 stock of companies maintained and reviewed by the editors of The Wall Street Journal.
* The NASDAQ Composite is an unmanaged index of securities traded on the NASDAQ system.
* International investing involves special risks such as currency fluctuation and political instability and may not be suitable for all investors. These risks are often heightened for investments in emerging markets.
* Yahoo! Finance is the source for any reference to the performance of an index between two specific periods.
* Opinions expressed are subject to change without notice and are not intended as investment advice or to predict future performance.
* Economic forecasts set forth may not develop as predicted and there can be no guarantee that strategies promoted will be successful.
* Past performance does not guarantee future results. Investing involves risk, including loss of principal.
* The foregoing information has been obtained from sources considered to be reliable, but we do not guarantee it is accurate or complete.
* There is no guarantee a diversified portfolio will enhance overall returns or outperform a non-diversified portfolio. Diversification does not protect against market risk.
* Asset allocation does not ensure a profit or protect against a loss.
* Consult your financial professional before making any investment decision.
* To unsubscribe from the Weekly Market Commentary please reply to this e-mail with “Unsubscribe” in the subject.


Investment advice offered through Research Financial Strategies, a registered investment advisor.

Very Important

Dear Clients, Soon-to-Be-Clients and friends,

Well, it looks like the party’s over. The S&P 500 has plunged through several levels of support. Take a look. Here’s the chart.

This chart shows the S&P when it was 3,332. Now, as I write, it sits uncomfortably at 3,319, down 1.12%. The DOW is down .88%. The Nasdaq has plunged 1.30%.

Yesterday, we took steps to protect our client portfolios. We have experienced extraordinary gains in our growth portfolios, but believe that the market is steadily approaching a strong market downturn. Therefore, we bought a rather significant position for all accounts in SQQQ, which gives us 3x the inverse of the QQQ (the Nasdaq). Thus, right now, the Nasdaq is down 1.30%. Our SQQQ position is up 4.01% on the day.

That gain will shield losses in long positions.

You might ask why we haven’t bailed on long positions. Well, we did flush out all positions in TQQQ (a long position 3x the gain in the QQQ). Also, you might have noticed that over the past week, we have taken profits on some long positions to protect your gains and to raise enough cash to take on the SQQQ short position yesterday.

But getting out of long positions can often be the wrong move. The markets have a nasty habit of forming what are called “whiplashes.” They can drop, and make everyone’s gut drop, and then turn back up on a dime. Those who’ve exited must then scramble to get back in.  

So, we prefer to use our system of basically neutralizing any gains or losses in turbulent stock markets. It has worked in the past. It will work in the future.

It’s hard to say where the markets will go from here. All three main indexes have built out chart patterns known as “Head & Shoulders” (not the shampoo!). These structures are always bearish and point to a decline of about 10%. The S&P could hit 3,000.

The key thing though is this: We are watching. We are ready to move when our indicators tell us to. We are using our discipline, and, we think, that’s why you want us to do what we do. It is extremely hard for an individual investor to have a system and truly stick to it.

So, sit back. Relax. Watch the elections unfold. They should provide quite a show. We do have some opinions on the impact the elections might have on the markets. Watch your inbox. We’ll send an election update soon.

 Cordially yours,

 Jack Reutemann

A Bump in the Road?​

End-of-Summer Market Update

Dear Friend,

Speed bump, stop sign, or red light? That’s the question many of us are asking.

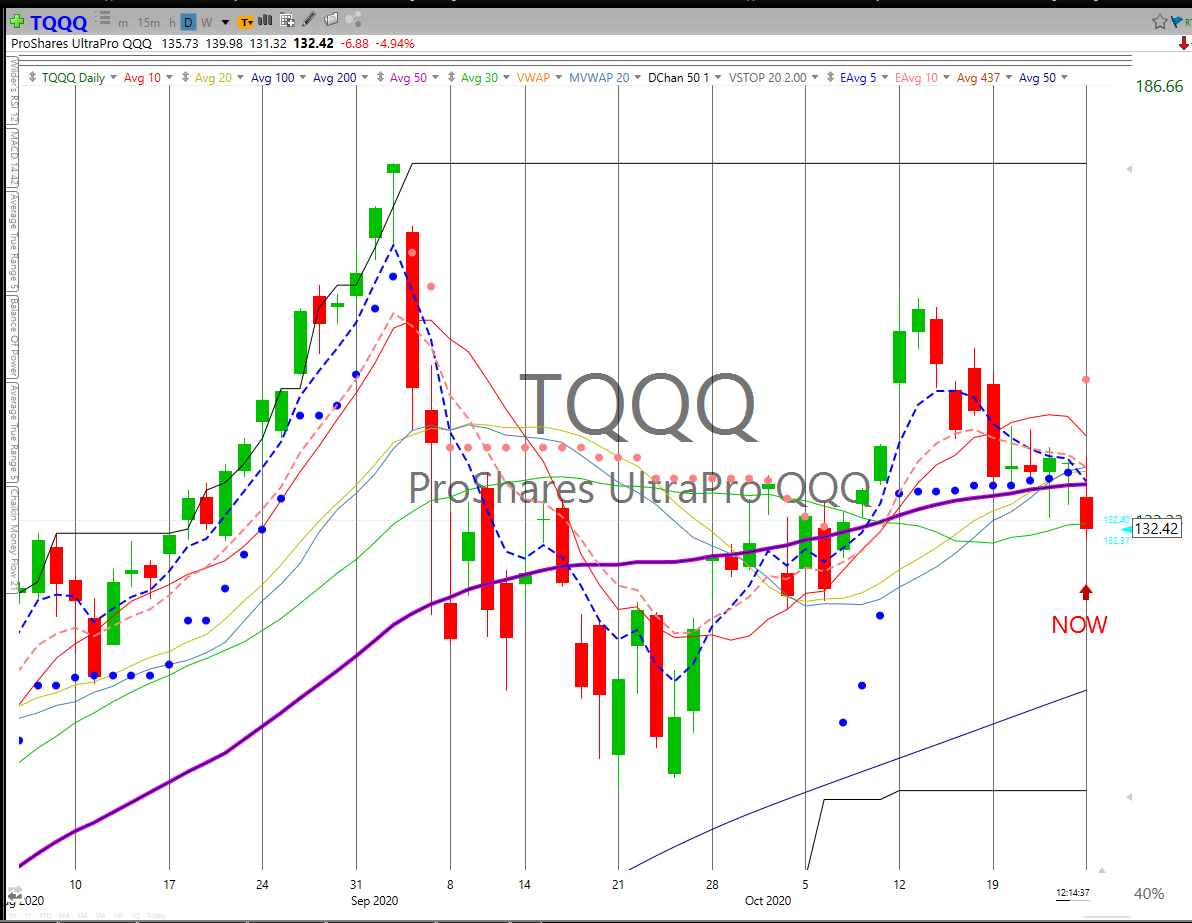
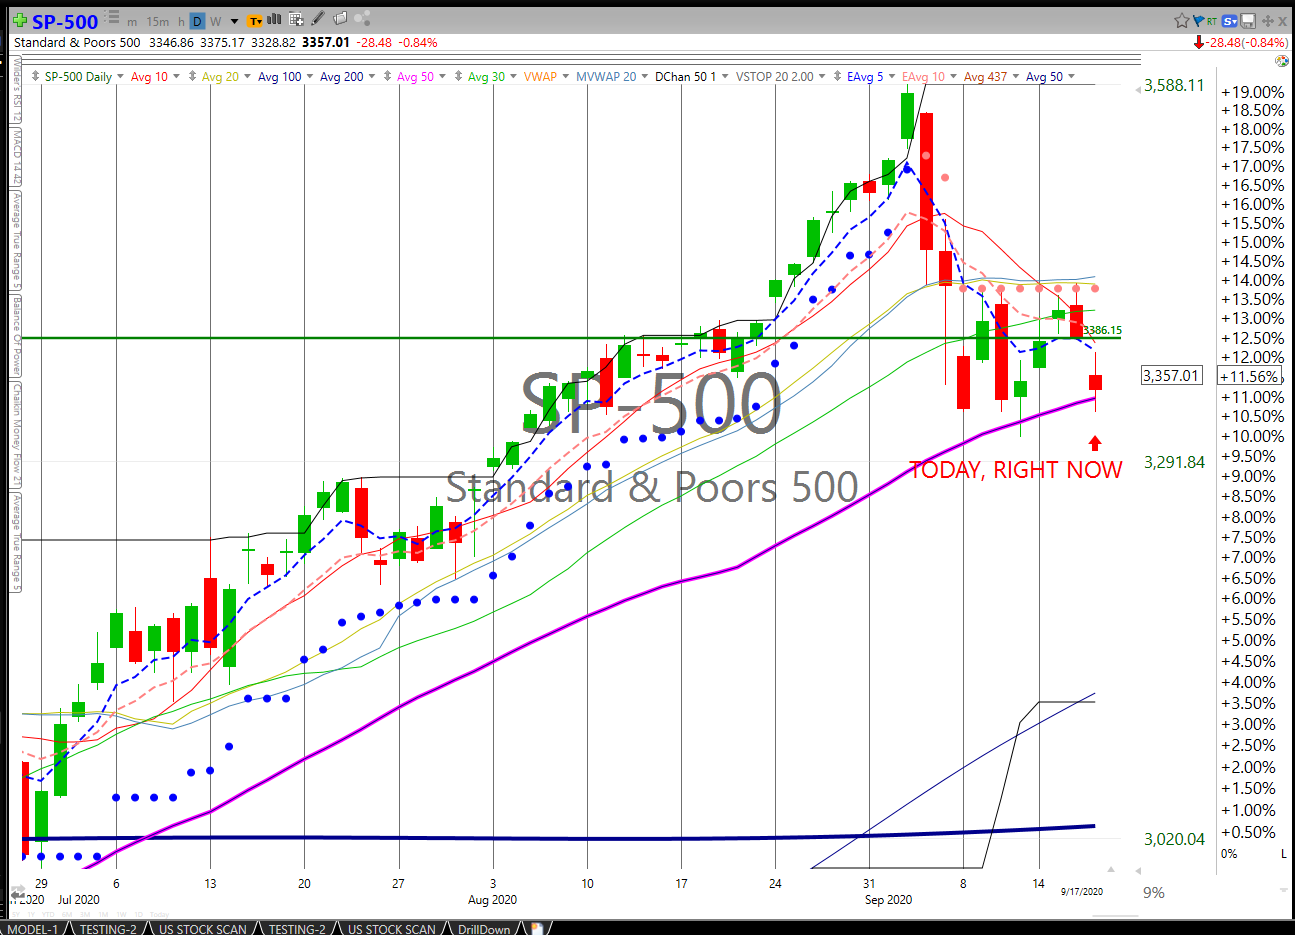
Let me explain. After cruising for the past five months, the markets screeched to a halt on September 3, the Dow dropping over 800 points, and the Nasdaq plunging nearly 5%.1 All told, it was one of the worst trading days for stocks since the pandemic-driven panic of March. The volatility continued the next day, albeit at lower levels.

So, what does it mean? Was Thursday’s selloff just a short-term blip—the equivalent of hitting a speed bump? Or was it the beginning of a market correction? If so, how long of a correction? Are we merely coming to a stop sign, or will we hit a red light?

Unfortunately, market signals are never as easy to interpret as road signs. But as we start winding down this bewildering year, investors will be gripping their steering wheels ever more tightly. That’s because they’re all trying to determine whether the markets will end the year on cruise control…or in full reverse.

Whenever you drive to a destination, it’s always good to familiarize yourself with the road beforehand. So, as this crazy summer draws to a close, let’s look at the different scenarios we could experience over the next few months.

As a heads up, we’re going to cover a lot of ground in this message. I believe my most important responsibility is to keep you not only informed about what’s going on in the markets but also prepared for what may come in the future. In this message, I will try to do both. Let’s dive in.

Speed Bumps

Between April and May, all three major US stock indexes—the Dow, the S&P 500, and the NASDAQ—climbed for five consecutive months. The S&P 500, for example, rose 60% over that period.2

Every so often, though, the markets experience a dramatic one- or two-day selloff. When those selloffs come during the middle of a major rally, like the one we’ve been experiencing, investors wonder whether it’s the beginning of a market correction. (A correction, remember, is when the markets fall at least 10% from their recent highs.)

Market corrections are relatively common. On average, we’ll see one at least once every 1 to 2 years.3 But more often, these selloffs are not the beginning of anything at all. They are simply speed bumps, and while they may seem random, there are usually underlying reasons for them.

For example, let’s take what happened on September 3 and assume it’s only a speed bump. Why did it happen? A closer look at which stocks fell may provide some answers. Specifically, tech stocks, including big names like Apple and Facebook, were the ones that suffered the most—just as those same stocks have largely fueled the markets rally. (More on this in a moment.) There are a few possible reasons for this. One is that many investors may simply have been cashing out of tech stocks to realize their gains. Another reason is that, because prices for tech stocks have risen so high, many traders may feel there’s simply no justification for plowing more money into them. When that happens, traders and short-term investors often move their money into other sectors they feel are undervalued.

In other words, the shudder that went through the markets is like the one you feel when changing gears in an old car. If that’s the case, the selloff was likely just a speed bump. A short pause for investors to take a breath before the markets resume their climb.

Here’s another reason why many selloffs are just speed bumps: The Federal Reserve. After the country went into lockdown, the Federal Reserve did many things to prop up the economy.4 First, it lowered interest rates to historic lows. This was to lower the cost of borrowing on mortgages, auto loans, home equity loans, and others—a key step to keep the economy moving. Second, the Fed launched a massive bond-buying program. This is another way to keep interest rates low. The Fed has also been lending money to securities firms, banks, major employers, and some small businesses using a variety of means.

These are all familiar tactics for anyone who was paying attention during the Great Recession. Then, as now, the Fed’s actions indirectly propelled the stock market. That’s because lower interest rates prompt increased spending, which in turn causes stock prices to rise. And, perhaps more importantly, the Fed’s massive increase in the money supply juices the stock market. After all, that new money wants a home, it wants a return. It looks at bonds and says, No, no return there. And so it rushes into the US stock market.

As long as the Fed keeps its stimulus programs in place, stocks will continue to be one of the most attractive places for people to put their money. And since the economy remains on very shaky ground, it’s unlikely the Fed will pull back any time soon. “Don’t fight the Fed,” investors are often counseled. Thanks in large part to the Federal Reserve, the stock market continues to be the shortest, surest road for investors to travel. That’s why many selloffs are nothing more than speed bumps.

Stop Signs

Of course, sometimes a selloff is more than just a speed bump. Sometimes, it’s like a neon light flashing: STOP SIGN AHEAD.

When this happens, Wall Street-types like to call it a market correction—a decline of 10% or more from a recent high. There are many reasons why corrections occur. One thing many corrections have in common, though, is they come after months of major market growth. When prices rise extremely high, extremely fast, it’s as if the markets have “overheated” and need to cool off.

It wouldn’t be a surprise if that’s what we’re seeing right now. Again, the S&P 500 rose 60% between March 23 (its most recent low) and September 2 (its most recent high).2 In that same period, the tech-heavy NASDAQ rose roughly 75%!5 Those are staggering numbers. One could argue we’re overdue for a correction.

Speaking of tech-heavy, let’s talk about technology stocks for a moment. When the markets plummeted in March, these stocks were one of the few safe havens around—and they’ve also been the best performers since then. That’s no surprise. At a time when most Americans were largely confined to their homes, it was our technology—from our iPhones to Zoom, from Google to Netflix—that kept the economy going. But remember how I said the S&P rose 60%? Peek under the hood and you’ll see those numbers were driven by two sectors: technology stocks and consumer discretionary stocks. (Think Nike, McDonald’s, Home Depot, etc.) Other sectors either performed much lower or are still in the red. So when we say the markets have recovered well, what we’re really saying is that the top sectors have performed enough to make up for those still struggling.

It’s one of the many reasons the stock market simply isn’t a reliable barometer for the overall economy.

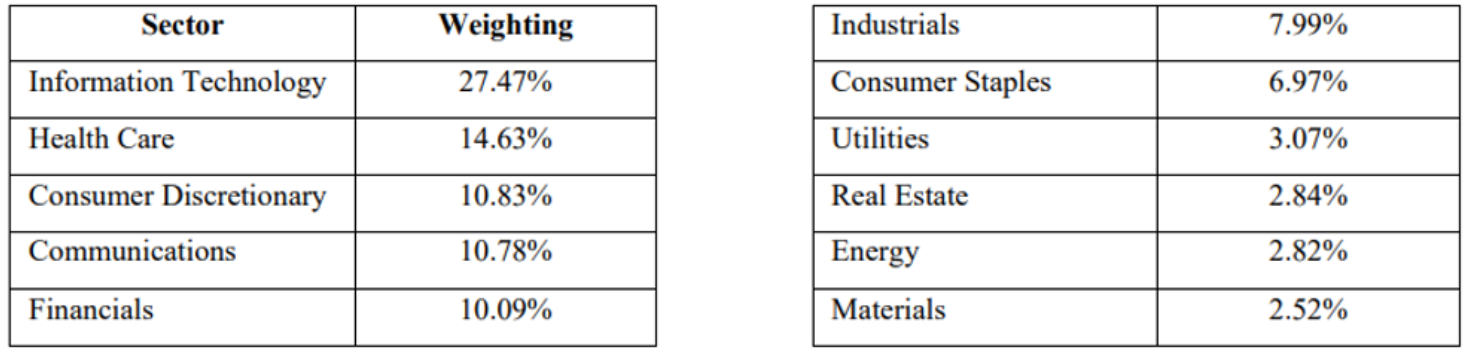
What does this have to do with a market correction? A lot, actually. It’s all thanks to these two terms: capitalization and weighting. Remember, the S&P 500 is an index, not the actual stock market itself. It’s essentially a collection of the five hundred largest companies listed on U.S. stock exchanges, which is where stocks are traded. More specifically, the S&P is a capitalization-weighted index. Without getting too technical, that means the largest companies make up the largest percentage of the index. For example, Amazon, Apple, Microsoft, Facebook, and Google—just five companies—make up 20% of the index!6

Look at that list of companies again. Notice anything about it? Yep, you guessed it: four of them are tech companies. In fact, if we break down the S&P 500 by sector, you’d notice that technology dominates the S&P 500. Actually, let’s do that right now.7

As you can see, the S&P 500 is currently overweighted to technology stocks, to the tune of 27.4%. So if tech stocks were to endure any type of prolonged selloff, that would have a major impact on the S&P 500 as a whole—and could well lead to an overall market correction.

Red Lights

Some market corrections last only a few days or weeks. When that happens, it’s like coming to a stop sign. A brief pause, and then we continue our journey.

But some corrections last longer than that. According to one report, the average correction lasts around four months. When that happens, it’s more like hitting one of those annoyingly-long red lights, just as you’re heading home and the sun is in your eyes. The kind that makes you think, “What does the universe have against me today?”

Before I go on, note that I’m not predicting that is what’s happening here. I don’t try to predict the future—that’s a game for fortune-tellers. Instead, I try to prepare for the future. And to be frank, it’s possible we could see a longer correction in the not-to-distant future. That’s because the future contains a lot of question marks, any of which could prompt the markets to pull back.

For starters, there’s the economy. While the markets enjoyed a V-shaped recovery after March, the overall economy has not. Things are improving, but still a long way from healthy. For example, the U.S. added 1.4 million jobs in August alone…but it’s still down 11.5 million jobs since the pandemic began.8 In other words, things are much less bad than before—but they’re still historically bad. The markets have hummed along despite all this, but at some point, it’s possible the economic reality could drag stock prices down.

At the same time, we’re seeing renewed Trade War fears with China. We’re also only two months away from a bitter presidential election. Historically, the markets don’t really care who sits in the White House, so there’s no reason you should let the election impact your financial thinking. (I’ll have more information on this in the coming weeks.) But in the runup to the election, we can certainly anticipate more volatility as people worry about who will win and what it means.

And of course, there’s COVID-19. We’re all sick of hearing about it, but it’s still a fact of life and will continue to be so for some time. Should cases surge in tandem with the upcoming flu season, the markets may retract into their shell.

In short, it’s certainly possible that we see a market correction over the next few months. But whether we do or not, it’s important to remember that corrections are inevitable and temporary. Corrections can even create opportunities for the future, as they open the door for investors to pick good companies at lower prices.

So what do we do now?

Remember: We can’t predict the future. But we can prepare for it. The fact is, we’re on a road we’ve never been on before—as investors and as a country. In real life, whenever we drive on an unfamiliar road, we drive cautiously, keeping our eye out for hazards. The same is true with investing. Speed bumps are only an annoyance when we go over them too fast. Stop signs and red lights are only dangerous when we speed past them. That’s why we use technical analysis to determine which way the markets are trending. By doing that, we can spot these road blocks ahead of time and slow down (or pull off to the side of the road) accordingly.

Unlike buy-and-hold investors, we don’t need to fear the occasional bout of market volatility. Because we follow set rules for when to enter and exit the markets, we don’t mind stopping occasionally. We are prepared to play defense or even move to cash at any time. That’s what helped us when the markets crashed in March. It’s what will help us moving forward.

Should a downturn happen, your portfolio is prepared. Now we just need to prepare ourselves mentally and emotionally in case there are stop signs and red lights ahead. And if it turns out to be a speed bump? That’s fine, too. We were already driving the speed limit.

As always, my team and I will keep a close eye on the road ahead. In the meantime, enjoy the end of your summer. Please feel free to contact me if you ever have any questions or concerns. I am delighted to be of service in any way I can.

Sincerely,

Jack Reutemann, Jr. CLU, CFP®

SOURCES
1 “Dow and Nasdaq plummet in the worst day since June,” CNN Business, September 3, 2020. https://www.cnn.com/2020/09/03/investing/nasdaq-selloff-stock-market-today/index.html
2 “S&P 500 Historical Prices,” The Wall Street Journal, https://www.wsj.com/market-data/quotes/index/SPX/historical-prices
3 “Here’s how long stock market corrections last,” CNBC, February 27, 2020. https://www.cnbc.com/2020/02/27/heres-howlong-stock-market-corrections-last-and-how-bad-they-can-get.html
4 “What’s the Fed doing in response to the COVID-19 crisis?” Brookings, July 17, 2020. https://www.brookings.edu/research/fed-response-to-covid19/
5 “Nasdaq historical prices,” The Wall Street Journal, https://www.wsj.com/market-data/quotes/index/COMP/historical-prices
6 “5 companies now make up 20% of the S&P 500,” Markets Insider, April 27, 2020. https://markets.businessinsider.com/news/stocks/sp500-concentration-large-cap-bad-sign-future-returns-effect-market-2020-4- 1029133505#
7 “U.S. Stock Market Sector Weightings,” Siblis Research, June 30, 2020. https://siblisresearch.com/data/sp-500-sectorweightings/
8 “U.S. adds 1.4 million jobs in August,” CNN Business, September 4, 2020. https://www.cnn.com/2020/09/04/economy/jobsreport-august-2020/index.html​​

Aug 3, 2020 Market Update

Good morning.

At this writing, the futures for the Dow, the S&P, and the Nasdaq are all showing that color we all love: Green. And as Kermit the Frog reminded us back in 1970, “It’s not that easy bein’ green ….”

It’s sure as heck not easy being green in 2020—not after one of the biggest plunges in stock-market history.

But that’s exactly what we are … Green! Big Time!

Right now, in our Aggressive Growth Portfolios, we are so green that we’re beating the S&P in a very big way: The S&P is up 1.25%. But we are up 18.70%, net of all fees and expenses.

So we hope this makes your day.

As we’ve said before, if you are in one of our blended accounts with fixed income, your results will differ.

So rest easy. We’ve got your back. Pay attention to real things … your family … your friends … your community. We’ll pay attention to your wealth.

Best regards to all,

Jack​

Friends and Clients, I’ll be brief. All is well with our managed accounts

Friends and Clients,

I’ll be brief. All is well with our managed accounts. Through July 15, the RFS pure aggressive growth model is up 15.98% for the year, while the S&P 500 index is down 0.13%. Essentially, we are beating the index by 16%. We hope you are pleased with that performance. As always, keep in mind that if you are invested in one of our models that blends with fixed income, your results will differ.

I have been getting a lot of phone calls and emails asking, “Jack, are we going to have another market crash? Should we just get out now?” I don’t think so. Not yet, anyway. We could have another 10 to 30% market sell-off between now and the election, and we are prepared for that. We take offensive positions when our indicators point in that direction. And when they point down, we don’t hesitate to play defense. In fact, our defensive strategy includes some offense because we take on short positions that profit handsomely in down markets. You all know firsthand what we did in March, when we established SPXS positions that produced positive gains as the market crashed.

The recent market rebound has been directly tied to improving economic numbers, and the perception that the CV-19 crisis is getting better. Unfortunately, the Johns Hopkins statistics (available for free everyday in the New York Times) do show a spike in Corona cases in the U.S. and throughout the world. Just yesterday, for example, new Corona cases in the U.S. totaled 77,217. Further spikes could negatively impact the market. We watch these stats daily.

I am “optimistically cautious,” and on full alert at the same time. The current political and racial discourse is destroying our country and our families, and we are in the middle of a very nasty Presidential election cycle. But at the end of the day, there is more good news than bad. Otherwise, the markets wouldn’t be going up.

As you have all heard me say on many occasions, “The only truth is supply and demand. Everything else is someone’s opinion.” There are well over 100 news commentators a day on all the major channels, all with an opinion. They don’t matter. Rule # 1 in technical analysis: the only truth is the “price.” 

Here’s my personal opinion: I hope the market does crash. We will make a fortune with our defensive shorting strategy, and a lot of ignorant investors will finally get the message, one more time: “buy and hold” is an academic, institutionalized falsehood, fabricated and promoted by the . . . for want of a better term, I’ll make one up …. “broker-dealer/mutual fund industrial complex.”

We’ve got your back. The RFS Team is doing, and will continue to do, a great job protecting your money.

Like most of you, I am working from home. Awfully quiet around here. Don’t hesitate to give me a call on my cell phone at 240-401-2355.

And, if you’re so inclined, you can always add funds to those we manage.

With kind regards,

Jack


John F. Reutemann, Jr., CLU, CFP®
Founder and CEO
Financial and Wealth Advisor
2273 Research Blvd., Suite 101
Rockville, MD 20850-3264
Phone: 301-294-7500
Fax: 301-294-7504
john.reutemann@rfsadvisors.com
www.rfsadvisors.com 

Check out our latest Weekly Market Recap

 Investment advice offered through Research Financial Strategies, a registered investment advisor.  Securities offered through Purshe Kaplan Sterling Investments, Member FINRA/SIPC, headquartered at 18 Corporate Woods Blvd., Albany, NY  12211.  Purshe Kaplan Sterling Investments and Research Financial Strategies are not affiliated companies.

 Trading instructions sent via email, fax or voicemail will not be honored.  There is no assurance that these messages can be retrieved on a timely basis, nor is there any sure method of confirming the customer’s identity.

 The information contained in this message is being transmitted to and is intended for the use of only individual(s) to whom it is addressed.  If the reader of this message is not the intended recipient, you are hereby advised that any dissemination, distribution or copying of this message is strictly prohibited.  If you have received this message in error, please immediately delete.​

How Are Your Investments Doing Lately?  Receive A Free, No-Obligation 2nd Opinion On Your Investment Portfolio >

Most Popular Financial Stories

Memorial Day Thoughts

Memorial Day Thoughts

Memorial Day Thoughts When I was young, I remember asking my parents why we observe Memorial Day. While some people use it mainly as a chance to throw a backyard...

read more
Stimulus Bill Analysis

Stimulus Bill Analysis

The New Stimulus Bill President Biden just signed another stimulus bill, aimed to help those affected by the virus (and to deal with a few other matters found in...

read more
Trending Now-2021-S&P Hits 4000

Trending Now-2021-S&P Hits 4000

milestone (noun)1 a stone functioning as a milepost 2. a significant event or stage in the life, progress, development, or the like of a person, nation, etc. The...

read more
End Of Week Market Update

End Of Week Market Update

End Of Week Market Update One year.  It seems incredible, but it’s been one year since COVID-19 struck our shores.  One year since the World Health Organization...

read more

6Lc_psgUAAAAAA9c7MediJBuq3wAxIyxDSt73c9j