Special Message

Look!

Have You Noticed?

Listen to any politician or any news commentator these days, and they always begin a discussion or answer a question like this:

Look, when I served in the Senate ….

Look, as I wrote in my last column ….

Look, if the Republicans won’t ….

Look, if the Democrats won’t ….

Just listen to the evening news tonight, and you’ll see what I mean. They all say “Look!”

Drives me a bit nuts.

But Maybe …

But maybe we should “look.” Look around us. Look at some statistics. Look at some developing trends. And when we do look, what do we see?

Economic Destruction

It’s not a pretty sight. Inflation drives millions to seek second jobs. Rapidly increasing mortgage rates are destroying the housing market. Applications for refinancing (to pay for higher prices of everything) have plummeted. Big retail outlets must rid themselves of bloated inventories, at a huge cost to their bottom lines. Truncated summer vacations might lower household expenditures for gasoline, but they also help shrink economic activity and add to recession fears. And if that’s not enough, a six-van tour service in Hawaii now needs only one of those vans―pain in paradise. It’s not a pretty sight.

How Bad Is It?

Seeking Second Jobs

Look at employment trends. If you’ve gone to any restaurant or driven up to a McDonald’s, surely you’ve seen the plethora of Help Wanted signs. And if you’ve gone into some of those restaurants, you often see lines waiting for a table but a bunch of empty tables inside. The owners can’t get enough wait staff or cooks to serve a capacity crowd.

Where did everybody go? Many sat out Covid and cashed Covid checks supplemented with unemployment insurance. They liked living at home or in their parents’ basements and just didn’t return to the workforce.

That’s about to change. In the words of Columbia Business School professor Mark Cohen:

At the end of the day, there are only so many credit cards you can load up and things you can avoid spending on before you come to the reality that maybe you have to pick up a second job. It’s about how much do you bring in every month, how much do you spend—if you’re in a deficit position, you have to find another job or an additional job.[i]

The inflation that used to be “transitory” has now transmogrified into an inflation that is “rampant.” Just two years ago, inflation hovered around 2.0%. Now in June 2022, it’s jumped above 9%. Not a pretty sight:[ii]

These elevated inflation rates are driving millions of Americans to seek a second job. Many of these second jobs are “full-time jobs,” which the Bureau of Labor Statistics (BLS) defines as a job requiring at least 35 hours per week. Thousands of our fellow citizens are forced to work two full-time jobs, or 70 hours each week:

426,000 Americans worked that much in June, compared to 308,000 in February 2020, according to the St. Louis Federal Reserve Bank’s analysis of BLS data.[i]

The numbers grow exponentially when we look at the number of Americans seeking second part-time jobs.

A new survey from Bankrate.com shows that, because of inflation, 41% of Americans say they need to pick up a second job in order to make ends meet. That’s up from 31% in 2019.[ii]

What? Forty-one percent of Americans. How many tens of millions of people is that? Not a pretty sight.

Housing Market

Look at what’s happening in the housing market―often a barometer of the economy at large. What was a boom for home-sellers has become an exercise in price-slashing:

The pandemic housing boom is careening to a halt as the fastest-rising mortgage rates in at least half a century upend affordability for homebuyers, catching many sellers wrong-footed with prices that are too high. It’s an astonishing turnaround. Just a few months ago, house hunters felt pushed to make offers within days, waive inspections and bid way above asking. Now they can sleep on it and maybe even shop for a better deal.[iii] 

The post-pandemic high home prices of just a few months ago are now driving buyers away. So sellers must dramatically reduce their prices:

The turn in the US housing market has been sharp and swift. Just ask Karlyn and Jack Stenhjem, would-be downsizers who dropped the asking price for their home near Seattle by almost $100,000 since May.

[Their] house, with private access to lakes and trails, is now available for $899,000, a price that makes Karlyn Stenhjem “cringe.”[iv]

ReFi Market―Up 4%?

Look at the refinance market. When inflation eats into disposable income, people seek other sources of cash. Many were tapping into their home equity by refinancing their mortgages at progressively lower rates. Not now. Those mortgage rates are going through the roof (so to speak). But a week or so ago, we saw refinance demand increase by 4%. But guess what ….:

Refinance demand rose 4% for the week but was 76% lower than the same week one year ago.[v]

No, down 76%. So another source of extra cash bites the dust:

Total mortgage application volume was 52.7% lower last week than the same week one year ago, according to the Mortgage Bankers Association’s seasonally adjusted index. Sharply rising interest rates are decimating refinance volume, and those rates, along with sky-high home prices and a shortage of houses for sale, are hitting demand from potential buyers.[vi] 

Unloading Retail Inventories

Look at what the biggies are doing. Target, WalMart, and other retail giants had it all figured out: When the pandemic ended, there would be huge pent-up demand. The shut-in consumers would spread their wings and open their purses and wallets. The payday would be huge

Oops. The heavy hand of inflation said no to those plans. Consumers certainly felt the new-found freedom of escaping the harsh Covid lockdowns, but inflation prevented them from buying high-end retail items and expensive clothing. Instead, they spent their money on gasoline, food, and other necessities.

The retailers faced a gigantic dilemma: What to do with bloated inventories? Put them on-sale? Offer a BOGO (Buy One Get One Free)? Store the goods for better times ahead? Offload them to bargain sellers like TJ Maxx?

Reuters wrote an interesting article about this quagmire: Sell, Stow or Dump? Retailers Wrestle with Mountain of Unsold Stock:

In the United States, clothing sales fell 89% in April from the same month in 2019, while in Britain clothing sales sank by 50% compared with an already-squeezed March.[vii]

So the anticipated post-Covid demand just isn’t there. If the big retailers opt to off-load expensive brands, savvy consumers should stand ready to cop some fabulous deals. Look at the plans of one California socialite:

“We’re going to see the most insane sales,” said Melissa McAvoy, founder of events company Luxury Experience & Co, who lives in the celebrity-studded Los Angeles suburb of Calabasas.

The 43-year-old said she planned to snap up merchandise at a discount, to then resell it at a higher price online at a site such as California-based Poshmark, which also makes money by taking a commission on sales.

“I’m going to get a tonne of stuff and either wear it once or put it on Poshmark,” she said.[viii]

Truncated Vacations

Look, or in this case, listen to identical conversations―typically between a Mom or Dad and their teenaged children―echoing throughout households across the country:

Mom or Dad: “But we are going to the beach this summer …. Just not quite as long.”

Teenaged Son or Daughter: “Quite? Last year we went for three weeks. And this year just one? That’s not fair.”

In millions of household budgets, money ordinarily set aside for vacations has jumped over into the column named “Gasoline” or “Weekly Food Budget.” Stats bear this out:

Majorities say they are likely to take fewer leisure trips (57%) and shorter trips (54%) due to current gas prices, while 44% are likely to postpone trips, and 33% are likely to cancel with no plans to reschedule. 82% say gas prices will have at least some impact on their travel destinations.[ix]

Needless to say, fewer people on the road affects the local economies of countless communities.

One short story from paradise makes the point:

Sunsets, surf and sand are still draws for visitors to Hawaii, but new statistics show their numbers are lower than usual for this time of year. That’s a big concern for those in the tourism industry, such as Carey Johnson, who runs Custom Island Tours. “We have four tour vans, I have six drivers,” she said. “So we can possibly be doing four tours a day, but right now we’re averaging less than one tour a day.”[x]

Look! Look Around You

You don’t have to look far to realize that this country―indeed, the entire globe―faces some dire economic circumstances. After the first quarter’s 1.6 percent decline in GDP and the second quarter’s 0.9 percent decline,[xi] the country officially entered a recession, according to traditional economic theory (two consecutive quarters of negative economic growth).

The White House begs to differ:

What is a recession? While some maintain that two consecutive quarters of falling real GDP constitute a recession, that is neither the official definition nor the way economists evaluate the state of the business cycle. Instead, both official determinations of recessions and economists’ assessment of economic activity are based on a holistic look at the data—including the labor market, consumer and business spending, industrial production, and incomes. Based on these data, it is unlikely that the decline in GDP in the first quarter of this year—even if followed by another GDP decline in the second quarter—indicates a recession.[xii]

Look, whether a recession begins with two consecutive quarters of negative growth or some other definition prevails, our citizens know that today’s economy isn’t doing the heavy lifting needed to sustain the livelihoods of  332,403,650 Americans alive on January 1 of this year.[xiii]

Will we come out of this mess? Yes, Americans always do. When? No one knows. But we can all look around us and see that things probably won’t get better before they get a whole lot worse.

But better they will get.

One day.

Call US

As always, please call us at 301-294-7500. We are happy to answer any questions you have.

Special Message

Bonds CAN’T Fall Any Lower… Or Can They?

What once was considered a “safe” investment has taken a drubbing in 2022.  As of yesterday (June 06, 2022) the AGG (US Aggregate Bond Index) has fallen 10.42% 1.  Just for the record, a 10% drop is recognized as an official “correction” for equities. It would be hard to disagree that a 10% loss in bonds can be viewed as a catastrophe in a conservative investment portfolio.

Today, the Federal Reserve Prime Interest Rate (aka Prime Rate) is 4% 2.  That doesn’t sound that bad.  Especially compared to the past 40 years.  On December 19, 1980 the prime rate was a remarkable 21.5% 2.  It has fallen over the past 41 years to as low as 3.25% 2.  Comparatively, 4% vs 3.25% is barely a blemish on the safe and smiling face of the bond market…or is it?

Consider that interest rates historically move in the opposite direction of bond values.  As interest rates fell over the past 41 years, bond values have steadily been rising.  After 40+ years, bond investments have always been represented as the safe and conservative investment position.  After all, it’s difficult to  even remember when the last time it was this bad.  It’s been since 1977 that bonds values have fallen this painfully when surging inflation and spiking gasoline prices were hurting consumers. Sound recently familiar?

​The Federal Reserve (FED) is attempting to quell inflation with interest rate hikes.  The FED has indicated they will continue to raise rates by .5%  until inflation calms down and then they plan to raise future rate by .25% increases until they get inflation fully under control.

Until the FED navigates us out of inflation, you can expect bond values to continue to fall.

In our opinion, the day of fleeing to bonds for safety is gone, at least for the near to mid-term. 

So, the likely question on everyone’s mind is, “How does one avoid more and more losses in bond investments?”

Active management is our answer. 

As mentioned above, the AGG has fallen 10.42% 1.  We are active managers, and our Model Fixed Income account has lost only 2.51% in 2022 through June 06, 2022.  That is nearly an eight-percentage point difference between the benchmark and our returns.  It’s a lot easier to recover from a negative 2.5%  than from a 10% loss.

Essentially, you have three options:

1.       HOLD your bond investments and hope that interest rates fall in the very near future
2.       SELL your bond investments, go to cash, and endure the loss of purchasing power to the high rate of inflation
3.       ACTIVELY MANAGE your bond investments to avoid further losses and capture their eventual upswing

We believe Active Management is a path that gives you the best chance for success.

If you have questions or just want to talk about your concerns, please don’t hesitate to contact us.


Sources:

1.        https://www.investing.com/etfs/ishares-barclays-agg-historical-data (reset the date timeframe to 1/1/2022 through 06/06/2022 and look at the cumulative total loss of the AGG at the bottom of the data listing)
2.        http://www.fedprimerate.com/wall_street_journal_prime_rate_history.htm#current (all dates are listed)


Important Market Update

Dear friends and clients,

You’ve heard about it on the news, you’ve felt it at the grocery store and at the gas pump, you’re having to deal with it every day. 

It is inflation.

We didn’t hear much about it in the news or feel its impact until very recently.  With a 1.4% increase just in the month of March, the US Producer Price Index (PPI) recorded the highest ever year-over-year increase in history. The famous US Consumer Price Index (CPI) saw its highest year-over-year increase in 40 years. Together, these two price indexes highlight the serious threat rising prices have on your purchasing power and your investment portfolios.  In other words, inflation does not limit its impact to your grocery purchases, it is also weighing on your life savings, and for many, their daily choices.

Inflation’s impact on the financial markets has been strong and immediate.

Familiar stock market Indexes

·         S&P 500 Index (SPX)  -13.31% (NEGATIVE)

·         NASDAQ Composite Index (COMPQX)  -21.16% (NEGATIVE)

·         Dow Jones Industrial (DJ-30) Index  -9.25% (NEGATIVE)

·         Barclays Aggregate Bond Index (AGG)  -9.83 (NEGATIVE)

Yes, you read that correctly.  All major indexes are languishing in negative territory.

·         S&P 500 is in correction territory (10% loss)

·         Tech-heavy NASDAQ is in bear market territory (20% loss)

·         Dow Jones is just ¾ of 1% shy of being technically designated as being in correction

Add to that the beating taken by bonds this year.  If you have traditional bonds or bond funds, you’ve likely seen your bonds values fall and accordingly the AGG is just 17 basis points shy of being in an official correction.  For bonds, that is serious because many have been led to believe they are a “safe haven” for retirees desiring a less risky investment. 

If you recall our presentation from September 2020 entitled “Dangerous Times”, you’ll remember we illustrated and warned of a perfect storm forming due to 40 years of falling/low interest rates and low inflation that led to all-time low interest rates and all-time high stock market values.  The perfect storm is now on our shores.  Rising interest rates and inflation are sending markets tumbling and bond values crashing.

In this storm, it seems like there is no good place to hide and wait it out.  Historically, when inflation grips our economy, cash loses purchasing power and commodity prices rise as a hedge against falling market indexes.

What is a commodity? 
A commodity is a basic good used in commerce that is interchangeable with other like-commodities. Traditional examples of commodities include grains, gold, beef, oil, and natural gas. The basket of commodities is varied and wide ranging; so, not all commodities will be a worthwhile inflation fighter.

Here are a few Exchange Traded Funds (ETFs) that represent various commodities and their results.  The percent return is for 2022 year-to-date through 4/29/2022.

Agriculture / Food

·         WEAT (Wheat) ETF 41.00%

·         CORN (Corn) ETF 39.18%

·         SOYB (Soybeans) ETF 25.63%

·         TAGS (Agriculture) ETF 27.69%

·         CANE (Sugar Cane) ETF 4.13%

·         JO (Coffee) ETF  -1.65% (NEGATIVE)

Energy / Oil / Alternatives

·         UNG (US Natural Gas) ETF 100.16%

·         USO (US Oil Fund) ETF 41.94%

·         XOP (Oil & Gas Exploration & Production) ETF 37.49%

·         TAN (Solar) ETF  -16.55% (NEGATIVE)

Natural Resources / Metals / Mining

·         JJN (Nickel) ETF 52.54%

·         SLX (Steel) ETF 17.07%

·         GLD (Gold) ETF 3.48%

·         URA (Uranium) ETF 1.62%

·         WOOD (Timber/Forestry) ETF  -2.07 (NEGATIVE)

·         SLV (Silver) ETF  -2.19 (NEGATIVE)

·         LIT (Lithium) ETF  -22.8% (NEGATIVE)

While many commodities can be good inflation fighters, they can also be volatile.  As a result, you may have seen or will see RFS purchase an ETF and sell it rather quickly.  Our buying and selling rules are in place to prevent catastrophic losses while attempting to capture as much upside as possible.  This requires trends and indicators take root…which usually means we need to allow the ETF to solidify its direction over several days.  Once the direction seems solid, we act accordingly.

Nearly all of the above commodity ETFs are constrained by low daily volume and/or tax reporting complications.  As a result, Research Financial Strategies is limited to investing in diversified commodity ETFs such as energy and agriculture.

·         IXC (Global Energy) ETF 28.97% YTD

       o   Purchased 2/3/2022 is up 8.27%

·         PDBC (Commodity ETF 32.65% YTD

       o   First lot purchased on 3/22/2022 is up 4.19%

       o   Second lot purchased on 4/27/2022 is up 0.17%

These returns may sound small; however, when you compare them to what is happening to the markets overall, then you’ll find they are going in the opposite direction which is the right direction.

Do you have bonds? 
If so, then you may have noticed we sold many ETFs and mutual funds a while ago and purchased TBT.  TBT is an ETF that benefits from the 20-year treasury decreasing in value.  As mentioned above, rising interest rates negatively impacts bond values.  With the expectation that the Federal Reserve will continue to raise rates several times over the remainder of this year, it looks like bond values will continue to fall.  As bad as that sounds, your bond portfolio will benefit.  Since TBT was placed in our bond model portfolio it has earned 9.04% through 4/29/2022.

You may have noticed our equity and bond models both have large cash positions.  This is done on purpose.  Cash is a good loss-avoiding hiding place and better than bonds currently.  Inflation may erode some of your purchasing power while in cash but at least it won’t be exacerbated by bond losses.

How are we fairing?
2022-YTD as of 04/29/2022: 

·         RFS Bond Model  -1.35% (NEGATIVE) vs AGG Index  -9.83% (NEGATIVE)

·         RFS Equity Model  -13.56% (NEGATIVE) vs S&P 500  -13.31 NEGATIVE)

·         RFS Equity Model  -13.56% (NEGATIVE) vs NASDAQ  -21.16% (NEGATIVE)

RFS is beating the AGG and NASDAQ handsomely and keeping pace with the S&P 500.  Going forward we imagine a favorable rest of the year.

Bottom line, you, as an RFS client, are poised to potentially benefit as bond values fall and commodity prices rise.  No matter how long this turmoil lasts, we’ll be there fighting for you.

Questions? Please call us. 301-294-7500


Sources:
ETF and Index returns calculated using TC2000
Spotlight: Come On, Commodities by Direxion Funds
Commodities on Investopedia.com 
https://www.investopedia.com/terms/c/commodity.asp


SPECIAL EDITION MARKET UPDATE

Weekly Financial Market Commentary

April 12, 2022

Our Mission Is To Create And Preserve Client Wealth

Some Scary Grains of Truth

The Pain …

Perhaps we need to brace ourselves.

A slew of reputable sources are painting bleak pictures. Not just of the U.S. economy. But of the global economy. Pain peeks just over the horizon.

Bloomberg pulls no punches:

Global food prices are surging at the fastest pace ever as the war in Ukraine chokes crop supplies, piling more inflationary pain on consumers and worsening a global hunger crisis.[1]

In Ukraine, there’s the Black Sea Breadbasket Region. “Ukraine exports over 50 million metric tons of corn and wheat to the world, and Ukrainian farmers would normally be planting crops right now. With Putin’s invasion, that is unlikely to happen.”[2]

A photo in The Times of Israel shows what’s at stake.

“Farmers harvest with their combines in a wheat field near the village Tbilisskaya, Russia, July 21, 2021. (AP Photo/Vitaly Timkiv, File).”[3]

As Russian troops invaded Ukraine, breadbasket farmers were forced to neglect their bountiful fields; they had to fight or flee. The Ukrainian government announced that men 18 and older had to remain and take up arms. So farmers had to put get off their tractors and put down their scythes and sickles.

The war has thus upended “global trade flows and [has] fuel[ed] panic about shortages of key staples such as wheat and cooking oils. That’s sent food prices— which were already surging before the conflict started—to a record, with a United Nations’ index of world costs soaring another 13% last month.”[4]

And it’s not just food prices that are soaring. The inflation report of April 12 should put a pit in all our stomachs.

Inflation rose at the fastest pace in 40 years  in March as consumer prices jumped 8.5%

The consumer price index leaped 8.5% annually, the fastest pace since December 1981, the Labor Department said on Tuesday, likely cementing Federal Reserve plans for an unusually large half-point interest rate hike early next month. That increase is up from 7.9% in February and inflation now has notched new 40-year highs for five straight months.

Prices rose 1.2% from their February level, the sharpest monthly increase since September 2005. [5]

It goes without saying: The stock market does not like huge inflation numbers.

… Of No Gains

There’s pain ahead.

Russia has blockaded the Black Sea, so the strain on the global economy goes beyond food shortages.

Putin’s blockade in the Black Sea is an act of economic warfare against the world. Any shipping restrictions in the Black Sea will not only slow trade but will also make it more expensive. Countries in the Middle East and Africa rely on the Black Sea trade for critical supplies such as wheat. Even the U.S. relies on Black Sea trade to export more than $130 million of poultry products to Central Asia and other countries in the region.[6]

… Stays Mainly

Sunflowers also suffer. Who cares about sunflowers?

Sunflower oil is a key ingredient in all sorts of foods. Ukraine provides nearly half the world’s supply of sunflower oil. Russia’s invasion has set the sunflower oil industry in turmoil.

Thousands of items, also including ready meals and even wrapping paper, use sunflower oil. Prices are surging and the ingredient will only become more scarce from the summer as Ukrainian farmers may struggle to grow and export the crop. [7]

Companies like Martin’s Snacks that rely on sunflower oil will be particularly vulnerable. Ukraine is the largest exporter of sunflower oil in the world, responsible for up to 46% of sunflower-seed and safflower oil production, according to the Observatory of Economic Complexity. The second largest producer is Russia, which exports about 23% of the world’s supply.

Sunflower oil is now $1.28 per pound, versus the $0.60 it cost in September 2020. [8]

…In the Grain

But grain remains the key. Wheat and corn. The staples of the world.

According to Bloomberg;

Russia’s invasion has caused a humanitarian disaster in Ukraine and disrupted trade in foods across the world, sending wheat and corn prices to the highest in a decade. Ukraine is a key supplier of grains to countries in the Middle East. Meat prices are also under pressure as the cost of the feed used for cattle and pigs rises. 

The two countries are key players in certain major global industries, like computer chips, sunflower oil, grains, petroleum, and wood. Together, they account for more than a quarter of global wheat exports. Ukraine produces somewhere around 70-90% of the world’s neon gas, which is a vital component of the microchips used to manufacture smartphone and computer screens. Russia is responsible for 13% of the world’s crude petroleum exports, which means anything that requires transportation at any stage of production—almost everything—will be impacted. Penfield predicts inflation may hit 11% by the end of the year.9

The Pain of No Gains Stays Mainly in the Grain

Investors, brace yourselves. Don’t expect assets to show any gains in 2022. The real challenges lie not in seeking gains but in avoiding gargantuan losses. We can’t expect the disaster unfolding in Ukraine to cause just a blip in world stock markets. We might just see lots of red in charts with arrows pointing only in one direction: down.

Avoiding the Pain of Losses

Here at Research Financial Strategies we will turn all our analysis and energies toward preserving the capital of our clients.

The RFS strategy of concentrating in three themes in energy, oil and natural gas; commodities, food, groceries, wheat, corn, sunflower seeds, etc.; and metals and mining, aluminum, steel, copper, lithium, platinum, palladium, uranium, etc., have all paid off recently.

No gains certainly cause pain. But that’s nothing like the pain of losses.

As always, we encourage you to pass this email along to family and friends. We would welcome the opportunity to help them preserve their hard-earned assets.

How Are Your Investments Doing Lately?  Receive A Free, No-Obligation 2nd Opinion On Your Investment Portfolio >

Most Popular Financial Stories

Happy Independence Day

Happy Independence Day

Happy 4th of July! Whether you’re celebrating with a cookout, a family gathering, or watching the fireworks with friends, Independence Day reminds us how lucky we all are to...

read more
Inflation Drops; Fed Changes Outlook

Inflation Drops; Fed Changes Outlook

“It ain’t over ‘til it’s over.” Words of wisdom from baseball legend Yogi Berra. And words that Fed Chair Jerome Powell has taken to heart. “Inflation has eased over the...

read more
This Memorial Day…

This Memorial Day…

Memorial Day is so much more than a long weekend. It is a chance for us to remember those who gave all for this great nation and the freedoms it offers. This Memorial Day,...

read more


Investment advice offered through Research Financial Strategies, a registered investment advisor.
* This newsletter and commentary expressed should not be construed as investment advice.
* Government bonds and Treasury Bills are guaranteed by the U.S. government as to the timely payment of principal and interest and, if held to maturity, offer a fixed rate of return and fixed principal value.  However, the value of fund shares is not guaranteed and will fluctuate.
* Corporate bonds are considered higher risk than government bonds but normally offer a higher yield and are subject to market, interest rate and credit risk as well as additional risks based on the quality of issuer coupon rate, price, yield, maturity, and redemption features.
* The Standard & Poor’s 500 (S&P 500) is an unmanaged group of securities considered to be representative of the stock market in general. You cannot invest directly in this index.
* All indexes referenced are unmanaged. The volatility of indexes could be materially different from that of a client’s portfolio. Unmanaged index returns do not reflect fees, expenses, or sales charges. Index performance is not indicative of the performance of any investment. You cannot invest directly in an index.
* The Dow Jones Global ex-U.S. Index covers approximately 95% of the market capitalization of the 45 developed and emerging countries included in the Index.
* The 10-year Treasury Note represents debt owed by the United States Treasury to the public. Since the U.S. Government is seen as a risk-free borrower, investors use the 10-year Treasury Note as a benchmark for the long-term bond market.
* Gold represents the afternoon gold price as reported by the London Bullion Market Association. The gold price is set twice daily by the London Gold Fixing Company at 10:30 and 15:00 and is expressed in U.S. dollars per fine troy ounce.
* The Bloomberg Commodity Index is designed to be a highly liquid and diversified benchmark for the commodity futures market. The Index is composed of futures contracts on 19 physical commodities and was launched on July 14, 1998.
* The DJ Equity All REIT Total Return Index measures the total return performance of the equity subcategory of the Real Estate Investment Trust (REIT) industry as calculated by Dow Jones.
* The Dow Jones Industrial Average (DJIA), commonly known as “The Dow,” is an index representing 30 stock of companies maintained and reviewed by the editors of The Wall Street Journal.
* The NASDAQ Composite is an unmanaged index of securities traded on the NASDAQ system.
* International investing involves special risks such as currency fluctuation and political instability and may not be suitable for all investors. These risks are often heightened for investments in emerging markets.
* Yahoo! Finance is the source for any reference to the performance of an index between two specific periods.
* Opinions expressed are subject to change without notice and are not intended as investment advice or to predict future performance.
* Economic forecasts set forth may not develop as predicted and there can be no guarantee that strategies promoted will be successful.
* Past performance does not guarantee future results. Investing involves risk, including loss of principal.
* The foregoing information has been obtained from sources considered to be reliable, but we do not guarantee it is accurate or complete.
* There is no guarantee a diversified portfolio will enhance overall returns or outperform a non-diversified portfolio. Diversification does not protect against market risk.
* Asset allocation does not ensure a profit or protect against a loss.
* Consult your financial professional before making any investment decision.
* To unsubscribe from the Weekly Market Commentary please reply to this e-mail with “Unsubscribe” in the subject.

Special Update

All,

You undoubtedly have heard reports that the world’s supply of wheat and corn are in jeopardy due to Ukraine and Russia both missing this season’s planting window for obvious reasons (click the link above to read more details). 
Did you know that Russia and Ukraine together supply

  • 30% of world’s supply of wheat
  • 17% of corn
  • 32% of barley
  • 75% of sunflower seed oil

You may not have heard; fertilizer, which is needed worldwide including the USA, is also in very short supply due to the war. 
The falling domino fallout of the Russia/Ukraine war is eye opening to say the least.
Falling domino #1, just in the past four weeks, prices have skyrocketed sending

  • wheat up 21%
  • barley up 33%
  • fertilizer up 40%

Falling domino #2, Brazil and Texas are cutting back on their use of fertilizers.  As you can imagine, that action will impact this season’s crop size at harvest time.

Falling domino #3, with smaller crop yields, there will be less feed for livestock and poultry resulting in lower animal weight and thus less chicken, eggs, turkey, pork, and beef in stores.  You’ve already seen rising prices this year on gasoline, would it surprise you to see the same with your groceries?

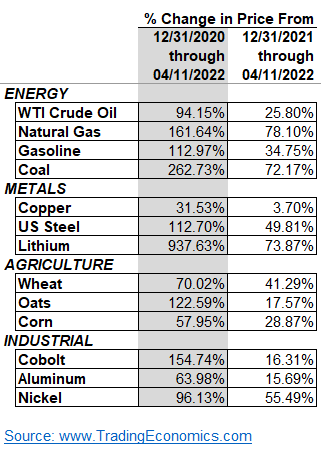
Falling domino #4, speaking of gasoline and energy.  Since January 1st of this year

  • Oil is up 39%
  • Natural Gas is up 56%

 Falling domino #5, cars, computers, TVs, phones, etc. require precious metals.  Since January 1st of this year

  • Nickel is up 65%
  • Aluminum is up 56%
  • Steel is up 27%

As the dominos rain down, prices and inflation will continue to rise.  Is it the worst idea to tighten your budget, set aside more money, and ready yourselves for a rough time ahead?

You may be worried about your investments and how they will fair amongst all of this chaos.  We too are taking precautions.  You’ll think we’re a bit mercenary or even morbid; however, we have positioned your accounts to benefit from this very sad and desperate situation. 

You’ll find your accounts invested in commodities, metals, and energy.  As inflation rises and the war rages, these positions could be buoyed by rising prices and falling dominos.  We may be wrong about the war’s impact and we hope we are; however, until we see otherwise, we’ll continue to position your assets in what we think offers the most opportunity for success while safeguarding against catastrophic losses.

If you wish to discuss this or any specific symbol in your portfolio, please do not hesitate to call.

Canaries in the coal mine!

Inflation and Other Hot Topics

When Your Dollar Shrinks

The best of financial planners must consider what happens to investors when their dollar begins to shrink. They planned on spending a certain amount per month in  retirement, for example, but … oops … the prices of gasoline and Cheerios went through the roof. If a set amount of dollars buys less, then the only solution is to increase the number of dollars available. Otherwise, the quality of life shrinks along with the U.S. dollar.

How to increase the number of dollars available? How to give yourself a raise?

Well, that’s what we’re here to do for you, our client. And we remain proud of, and steadfast in, that duty, especially these days when inflationary trends are sounding the alarm.

The Federal Reserve Beige Book

According to the Fed’s Beige Book, the recovering U.S. economy is grappling with significant labor shortages and higher prices for consumer goods.

The Outlook

The Federal Reserve’s latest deep dive on the economy confirmed the obvious: U.S. economic growth is picking up steam, but the recovery is being restrained by widespread shortages of labor and supplies.

While the economy has made a lot of progress, Fed Chairman Powell said on Wednesday that it still needs a lot of support from the Fed. He pointed to the millions of people currently out of work.

The Big Picture

The economy has plenty of momentum. Coronavirus cases are low, most government restrictions have been lifted, and Americans are spending plenty of money. Indeed, consumer spending accounts for about 70% of U.S. economic activity.

“The U.S. economy strengthened further from late May to early July, displaying moderate to robust growth,” the Beige Book said.

Cars and Trucks

In 2020, sales of used light vehicles in the United States came to around 39.3 million units. In the same year, approximately 14 million new light trucks and automobiles were sold here.

Currently, about 280 million vehicles operate on the streets of America. an increase of about 1.6 percent over the past year. The rising demand for vehicles means that used vehicle inventories are declining. The impact on prices is not surprising. Just last month, in June alone, the prices of used cars increased 10.5%. In the same month, new car prices rose 2.2%.

Construction

The construction industry in the United States accounts for 3.36% on the country’s GDP.  According to economic forecasts, construction in the United States will grow about 15.6% and amass a value of $1.515 trillion in 2021.

Although the construction and building materials industry in the United States has been facing challenges in the recent past that have slowed down its short-term growth, the medium and long-term growth in the industry is projected to remain relatively constant and positive. The expected compound annual growth rate will be 4.7% from the year 2021 to 2025. Moreover, the construction output for the US construction and building materials industry is projected to be as high as $1.819 trillion until the year 2025.

The Pandemic and the Building Industry

As the COVID pandemic has brought about a huge increase in outdoor renovation and construction projects, the demand for construction materials is also expected to rise. Consequently, the prices of construction and building materials have risen accordingly. The norm of social distancing during the pandemic has shifted people’s behavior from relaxing and entertaining visitors indoors to outdoors in patios, fire pits, and outdoor kitchens. Tents are in, ballrooms are out.

Even though construction activities have gained importance as the quarantine and lockdowns have lifted, the industry suffered significantly during the peak of the pandemic due to the weakened economy, disturbances in the supply chain, and delays in schedules. Contractors and construction workers suffered, too, as the lockdown required that they remain in their houses for months on end. Accordingly, the demand for building materials fell drastically.

Lumber

Lumber prices turned negative for the year as demand cooled after a red-hot rally.[1] Lumber futures fell 5.6% on Monday, taking it 0.6% below where it started the year. Home improvement demand has dropped, while suppliers have raised production.

Lumber prices have dropped into negative territory for the year after two months of dramatic falls, as the home improvement boom cools and producers increase supply to meet demand.

On Monday, lumber futures for September delivery fell 5.6% to $712.90 per thousand board feet, Bloomberg data showed. The fall took prices 0.6% below where they started the year.

Lumber soared in the first few months of 2021 as Americans stuck at home due to the pandemic renovated their houses and a booming property market added to demand. Prices peaked at more than $1,730 per thousand board feet in May as suppliers struggled to keep up.

But since the May peak, prices have plunged almost 60%. Analysts have said that the loosening of coronavirus restrictions has caused consumers to spend less on home improvements such as new yard decking and more on services like dining out, getting haircuts, and even going to the movies.

The Housing Market Inflates

An inflation storm is coming for the U.S. housing market. Fast-rising housing costs have helped cause the largest increase in inflation since 2008. But the way that government statisticians track the price of consumer goods may be missing just how explosive home-price growth really has been in recent months.

The cost of shelter rose by 0.5% between May and June, according to the latest edition of the monthly consumer price index released Tuesday by the Bureau of Labor Statistics. Compared with last year, however, shelter costs were up 2.6%.

Altogether, the rise in housing prices accounted for roughly a fifth of the overall increase in inflation in June, a reflection of how heavily government economists weight this spending category.

But much of that increase was actually driven by the rising cost of hotels and motel stays, which are factored into the overall shelter figure. Between May and June, the cost of a hotel room increased nearly 8%. Comparatively, housing costs for renters and homeowners rose 0.2% and 0.3% respectively, per the government’s inflation measure.

The latest edition of the consumer price index indicated housing prices have risen 2.6% over the past year, while other reports suggest home prices are up more than 13%.

In 2021, buyers are driving up home prices and homes sell quickly. Some hyperactive buyers make offers without seeing the property and forego contingencies to win bidding wars in the highly competitive housing market. The record-low mortgage rates have really sparked the increase in demand, especially among millennials. And they are encountering a shrinking supply of available homes.

The housing market is still far from normal, with inventories down over 38% year over year and at historic lows. The current supply of homes on the market registers an all-time low, dating back to the turn of the century. Due to a lack of supply and decreasing interest rates or borrowing costs, home prices have continued to rise in double digits. With the recovering economy, more buyers are entering the market. And because of the still-limited supply of housing inventory, home prices continue to rise.

With increased supply, home price growth will gradually moderate, but a broad price decline appears unlikely. The housing market will continue to attract buyers as a result of the drop in mortgage rates, which have fallen below 3%, as well as an increase in new listings. According to Realtor.com’s Hottest Housing Markets data, as of June 29, the most improved metros over the previous year were Tampa-St. Petersburg-Clearwater, Fla.; Detroit-Warren-Dearborn, Mich.; Nashville-Davidson-Murfreesboro-Franklin, Tenn.; Riverside-San Bernardino-Ontario, Calif.; and Jacksonville, Fla.

·         The median existing-home price in May was $350,300, up a record 23.6% from May 2020.

·         Supply shortages are holding new home sales back.

·         New home sales fell 5.9% in May from April, to 769,000.

·         The median sales price of new houses sold in May 2021 was $374,400, up 2.5% from April and 18.1% year-over-year.

According to the latest data from the National Association of Realtors, existing-home sales in May declined 0.9% from a month before a seasonally-adjusted annual rate of 5.80 million from April’s rate of 5.85 million. The 0.9% setback in existing home sales in May was the fourth straight monthly decline. Only one major U.S. region experienced a gain in sales month-over-month, while the other three saw sales fall. Each of the four regions, however, saw double-digit year-over-year growth.

Although housing sales were up 44.6 percent year on year (4.01 million in May 2020), the comparison is heavily skewed because the housing market was effectively shut down for two months at the start of the pandemic. Last summer, the market recovered and remained strong for the rest of the year. In May 2021, the median existing-home price for all housing types was $350,300, up 23.6 percent from last May ($283,500), with price increases in every region.

This is a record high and marks 111 straight months of year-over-year gains since March 2012. The inventory of homes for sale remained relatively low. At the current sales pace, it would take 2.5 months to sell through available inventory—a slight increase from 2.4 months in April, but significantly lower than the 4.6 months of supply at this time last year.

The National Association of Realtors released research earlier this month from the Rosen Consulting Group, estimating that between 5.5 million and 6.8 million new houses are needed to meet the demand. “Home sales fell moderately in May and are now approaching pre-pandemic activity,” said Lawrence Yun, NAR’s chief economist.

Pending Home Sales Rebounded Strongly in May

According to the National Association of Realtors, pending home sales reached their highest level in May since 2005, with gains recorded in all four U.S. regions both month-over-month and year-over-year. Pending home sales increased by 8% in May compared to April and were up 13.1% year on year. Home sales activity had dropped at the same time last year due to the onset of the COVID-19 pandemic.

A pending sale status indicates that the seller accepted an offer from a prospective buyer but that the transaction has not yet closed. Many sellers will prefer to wait for the best and highest offer. Pending home contracts are viewed as a forward-looking indicator of the housing market’s health because they become sales one to two months later.

Existing Housing Sales in May

According to data from the National Association of Realtors:

·         In the Northeast, existing home sales decreased 1.4% in May, but the annual rate of 720,000 represents a 46.9% jump from a year ago.

·         The median price in the Northeast was $384,300, up 17.1% from May 2020.

·         Midwest existing home sales rose 1.6% to an annual rate of 1,310,000 in May, a 27.2% increase from a year ago.

·         The median price in the Midwest was $268,500, an 18.1% increase from May 2020.

·         In the South, existing-home sales declined 0.4%, posting an annual rate of 2,590,000 in May, up 47.2% from the same time one year ago.

·         The median price in the South was $299,400, a 22.6% jump from one year ago.

·         In the West, existing home sales fell 4.1%, recording an annual rate of 1,180,000 in May, a 61.6% climb from a year ago.

·         The median price in the West was $505,600, up 24.3% from May 2020.

New Residential Home Sales

Buyer demand for new homes remains strong, and builders in most markets have little trouble selling the homes they have built. However, supply constraints limit the number of homes they can build and eventually sell, and the sales volume they can comfortably take on without exposing themselves to additional price risks is somewhat limited. Still, new home sales have risen during the pandemic. Those sales allow builders to raise prices.

Buyer traffic is converting into sales at a record rate. Residential construction ended in 2020 on a strong note. Housing starts rose 5.8% to 1.67 million annualized units in December. Total starts were 2.8% higher than a year ago. The demand remains strong as the prime buying season begins to heat up. Sales of new single-family homes in the United States fell to a one-year low in May 2021, as the median price of newly built houses rose due to high raw material costs, including framing lumber.

New home sales decreased 5.9% in May to a seasonally adjusted annual pace of 769,000, down from an upwardly revised April rate of 817,000, according to estimates released jointly by the U.S. Census Bureau and the Department of Housing and Urban Development. Higher building costs, longer delivery times, and general unpredictability in the construction supply chain are now having measurable impacts on new home prices. The median sales price of new houses sold in May 2021 was $374,400.

The average sales price was $430,600. The seasonally‐adjusted estimate of new houses for sale at the end of May was 330,000. This represents a supply of 5.1 months at the current sales rate. The median sales price of new houses jumped 18.1% from a year earlier to $374,400 in May. The average sales price was $435,400. The seasonally adjusted estimate of new houses for sale at the end of April was 316,000. This represents a supply of 4.4 months at the current sales rate.

Because new house sales are recorded when contracts are signed, they are considered a leading housing market indicator. The decrease in new housing sales suggests that demand is diminishing. Applications for house loans have declined this year, as have housing market surveys of potential purchasers.

Shoes? Yes, Shoes

The global footwear market is a multi-billion U.S. dollar industry. The United States has the largest footwear market in the world, amounting to over 91 billion U.S. dollars in revenue in 2019. A part of the clothing and apparel industry, the footwear market is comprised of shoes, sneakers, luxury footwear, athletic footwear, and sporting shoes, as well as other related goods. Footwear products are commonly made of leather, textiles, and a range of synthetic materials.

Nike’s share of US footwear market is 17.9%. Pairs of shoes imported into the USA total 2.47 billion. Advertising spent in the US footwear industry totals $12.6 billion.

Brace Yourself

We don’t have to look far to see evidence of inflation. And we don’t have to wonder why prices are rising. When the Federal Reserve increases the U.S. money supply at an annual rate of 37%,[2] those dollars have to go somewhere. They go into the stock market, into real estate, into art works, and … into the gasoline for your car and the Cheerios for your breakfast.

When those prices rise, so too must your income.

We keep a constant eye on these developments and recognize our duty of making sure your wealth grows at a rate that will protect your standard of living.

If you’d like to review your assets, please call us at 301-294-7500. We are always happy to answer any questions you have.


[1] https://www.nasdaq.com/market-activity/commodities/lbs   

[2] https://mises.org/wire/us-money-supply-was-37-percent-november

6Lc_psgUAAAAAA9c7MediJBuq3wAxIyxDSt73c9j