All,
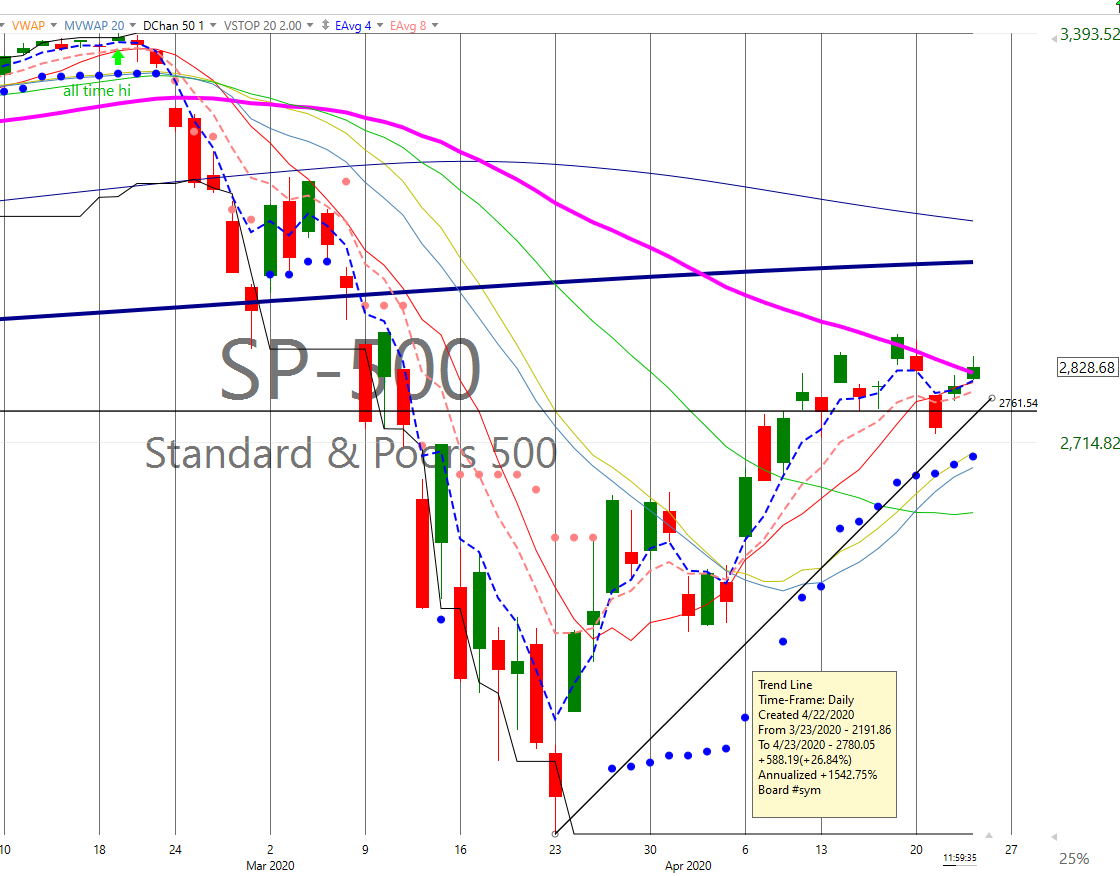
We are still on a “technical buy” – meaning we are staying in the markets. Please view the chart below. Green is good, red is bad, and we have a 45 degree trend line in play. Notice that today we have recovered the 50 day moving average, this is a good sign as it indicates a positive movement in the market. The farthest, right hand side green bar, crossing thru the thick Fuchsia line. Even though CV19 is still a major problem, and unemployment claims have gone up again this morning, many believe the worst may be behind us. Everyone has an opinion. Either way, the market is liking the prospects for a recovery, and partial state-by-state openings. Also, unless the deal falls apart at the last minute, another $425 billion small business stimulus package should pass the House today, having already passed the Senate.
I’m trying to not overload you with info, but just hit the high points.
As before, call me if you have any investment questions!!!
Jack
240 401 2355

Most Popular Financial Stories
Stock Pullbacks Are Helpful, Not Hurtful
Do me a favor: print the chart in this email and pin it to your wall. I want you to have a constant reminder that stock prices see pullbacks several times during the year....
Market Outlook by Jack Reutemann
All, Over the past two weeks, I have spoken with several clients about the current investment climate. I wanted to share our discussions with everybody. Is the Party Over?...
Market Update – January 2025
Happy New Year! The past 75 days have been quite eventful. Several clients have inquired about our investment approach for accounts not held at Schwab. To clarify, our...
Happy New Year!
Sending you warm thoughts and best wishes for a wonderful new year. May the days ahead be filled with joy, laughter, and prosperity for you and those you hold most dear.
Happy Thanksgiving
Thanksgiving will be here soon. The holiday always gives us a chance to appreciate what we have – friendships, relationships, and a sense of togetherness. These gifts are...
IRS Releases 2025 Tax Brackets
The Internal Revenue Service released the updated income tax brackets, standard deduction, and retirement contribution limits for the 2025 tax year. While these changes...

